Range Fade Strategy: Scalping Support and Resistance
TL;DR. The range fade strategy buys near the low of a defined trading range and sells near its high, betting that the next touch of the edge reverses like the previous ones did. It is the base method behind every range setup on this site, and it applies whenever price has bounced between two levels at least three times without making progress. The trap is the breakout: one range that stops holding can cost more than the last five fades earned, and on BTC the fees on a tight-stop fade can consume most of the edge. This lesson gives you the identification rules, a worked trade with numbers, the fee test, and the exit rule that keeps a range trader alive.
Prerequisites for this lesson: Support and resistance (what a level is and why it is a zone, not a line), Candlestick context and confirmation (the rejection candles used as triggers), Position sizing and risk management (how 1R is defined). The trade below is sized in R, so the sizing lesson matters.
What a range is and when it is tradeable
A range is a stretch of price action where neither side is winning. Price runs into a ceiling, comes back down, finds a floor, goes back up, and repeats. On a 5-minute BTC chart this can last an hour or a day; on the daily chart, months. Whatever the timeframe, the mechanism is the same: the buyers who defend the low and the sellers who defend the high have not been overwhelmed yet, so each trip to the edge meets the same resting orders and turns around.
Not every sideways stretch is a range you can trade. Four conditions have to hold:
- Horizontal boundaries. The highs cluster near one price and the lows near another. If the highs step up each time, it is a slow trend, not a range, and fading it means shorting an uptrend.
- At least three touches on each side. Two touches can be a coincidence. Three touches that all reversed tell you a level is being defended.
- Stable width. A range whose swings keep getting bigger is disagreement growing, not equilibrium. A range whose swings keep shrinking is compressing towards a breakout (the Bollinger squeeze shows this well).
- Enough height to pay for the trade. The range must be wide enough for a stop outside the boundary, a target inside it, and the fees in between. The fee test below puts a number on this.
Al Brooks, in his books on trading ranges, makes a point that every range trader should have on the wall: a trading range pulls price back towards its middle, and that pull is why most breakout attempts from a range fail. The range fade is the strategy that trades that pull. It is also why the range fade fails precisely when the pull finally breaks.
The entry logic
The idea is simple. At the bottom of the range, selling has been absorbed on every previous visit and buyers have stepped in. You are betting that the pattern repeats one more time. The edge is not the level itself; the edge is the evidence that the level is being defended again on this visit.
Long at support:
- Price reaches the lower boundary. Not near it, at it: within the zone the previous lows defined.
- A rejection candle prints and closes: a hammer, a bullish engulfing candle, or any candle whose lower wick pierced the zone and whose close came back above it.
- Volume on the approach was falling, not rising. Sellers running out of conviction is what you want to see; sellers accelerating into the level is the first sign of a breakout.
- Enter on the close of the rejection candle. Stop below the range low and below the rejection wick. First target at the middle of the range, second target just inside the opposite boundary.
Short at resistance is the mirror: the upper boundary, a bearish rejection candle (shooting star, bearish engulfing), volume drying up on the approach, stop above the range high and the wick, targets at the midline and just inside support.
Waiting for the close of the rejection candle costs you a little price. It also filters out the trades where the "rejection" was the first half of a candle that finished as a breakout. On a 5-minute chart the wait is at most five minutes. The lesson on stop hunts explains why the wick beyond the level is often the best part of the setup rather than a reason to skip it.
A worked trade with numbers
BTC perpetual, 5-minute chart, account $10,000, risk per trade 1% = $100 = 1R. Fees are the site's standard assumptions: maker 0.02%, taker 0.05%.
The range: low $99,400, high $100,600, height $1,200 (1.2%), five touches over three hours, each one reversed. Price returns to the low. The candle wicks to $99,420 and closes at $99,480 with a long lower shadow. That is the trigger.
| Item | Value |
|---|---|
| Entry (close of the rejection candle) | $99,480 |
| Stop (below the range low and the wick) | $99,300 |
| Risk per BTC | $180 (0.18%) |
| Position for $100 risk | 0.556 BTC, notional $55,300 (5.5× on the account) |
| Target 1: range midline, half the position | $100,000 (+$520 per BTC, 2.9R) |
| Target 2: just inside resistance, the other half | $100,500 (+$1,020 per BTC, 5.7R) |
| Maker fees, round trip | $22 (0.22R) |
| Result if both targets hit | +$428 gross, +$406 net |
| Result if stopped | −$100 − $22 = −$122 |
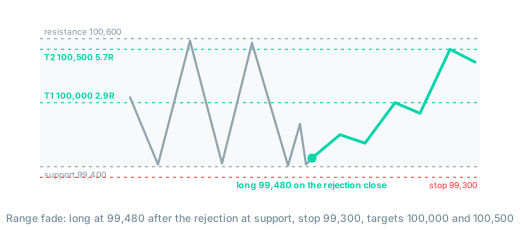
The R multiples look generous because the stop is tight relative to the range: 0.18% of risk against a 1.2% range. That is the attraction of range fading. The next section shows what the same tight stop does to the fee bill and to the win rate.
The fee test
A tight stop makes the position large. With $100 of risk and a $180 stop you hold $55,300 of BTC, and the exchange charges fees on the notional, not on the risk. Maker fees at 0.02% per side cost $22 per round trip, which is 0.22R on every trade, win or lose. Taker fees at 0.05% per side cost $55, or 0.55R.
Put that against an honest set of results for a tight-stop range fade. Wicks through the level stop you out often, targets are sometimes missed by a few dollars, and partial exits reduce the average win. A realistic long-run profile is a win rate around 50% with an average win of 1.5R and an average loss of 1R:
| Fee scenario | Gross expectancy | Fees per trade | Net expectancy |
|---|---|---|---|
| Maker both legs (0.04% round trip) | 0.5 × 1.5 − 0.5 × 1.0 = +0.25R | 0.22R | +0.03R |
| Taker both legs (0.10% round trip) | +0.25R | 0.55R | −0.30R |
The same setup, the same trader, the same chart. With limit fills it is barely positive; with market orders it loses a third of a risk unit per trade, every trade, for as long as you keep doing it. This is the most important number in range trading and the tutorials rarely mention it. The ratio to watch is fees divided by stop distance: 0.04% ÷ 0.18% = 22% of your risk goes to the exchange before the trade has started. A stop of 0.5% brings that ratio to 8%, and a stop of 1% to 4%, which is why range fading on a wider timeframe is easier to make pay than on the 1-minute chart. The lesson on trade execution covers how to get maker fills without missing the trade.
The dominant failure: the breakout
Every range ends. When it ends, price usually leaves fast, often travelling the full height of the range or more in a few candles, because the stops of everyone who faded the edge are sitting just beyond it and get triggered in sequence. A range fader who is short at resistance when the range breaks upward is on the wrong side of that cascade.
Signs that a range is about to stop holding:
- Volume rising into the boundary instead of falling. Aggressive participants are pressing the level rather than fading it.
- Touches getting more frequent with shallower pullbacks between them. Price is grinding at the ceiling instead of bouncing off it. Each touch consumes some of the resting orders that made the level hold.
- Open interest rising through the range. New positions are being built, not recycled, and someone intends to move price.
- Funding at an extreme. The range is crowded on one side and the crowd will be squeezed.
The exit rule: a candle that closes outside the range boundary ends the trade. Not "gives it room", not "waits for the retest". Closes outside, you are out, at the stop if it is already there or at market if it is not. The next section explains why the size of this rule matters more than any entry detail.
Why one breakout loss can erase a week
With the expectancy above (+0.25R gross per trade), one loss that is allowed to grow to 3R costs twelve trades of edge. A range fader who lets a breakout run against them because "it always comes back" is not making a small mistake; they are undoing a week of correct trades in twenty minutes. And because the range has been rewarding them for hours, the moment the breakout comes is exactly when confidence is highest and the stop feels unnecessary.
The mechanism is the same one the common mistakes lesson describes under averaging down: the strategy's win rate is high, so the losing trades feel like anomalies, and anomalies feel like something to add to rather than to cut. In a range that has broken, adding to the losing fade means buying more of a downtrend or shorting more of an uptrend. A stop 1 to 2 ATR beyond the boundary, placed at entry and never widened, is the entire defence.
Stop placement
The stop is the most consequential decision in this strategy, more than the entry.
- Just outside the boundary: many small stop-outs from wicks that never became breakouts. Cheap individually, expensive in aggregate, and the lower win rate pushes the fee test into negative territory.
- Well outside the boundary: fewer false stop-outs, but the loss on a real breakout is larger and the position is smaller for the same R, so each win pays less.
- 1 to 2 ATR beyond the boundary and beyond the rejection wick: the practical middle. Enough room for the typical probe of the level, tight enough that a real breakout is cut at roughly 1R.
Whatever you choose, choose it before the entry and record it. A stop that moves after the trade is open is not a stop.
When to stop fading the range
Switch the strategy off when:
- A candle closes decisively outside the range on above-average volume.
- The broken boundary has been retested from the other side and held (old support acting as resistance, or the reverse). That is now a breakout and retest, a different trade.
- The higher-timeframe trend is strong and against the side you keep fading. Buying support in a 1-hour downtrend is buying a lower high.
- You have been stopped out twice at the same edge. Two consecutive failures at the same level mean the level is not being defended the way it was.
Recognising that a range has ended is the same skill as recognising that one exists. Traders who cannot do the first will give back everything the second earned.
Checklist before a range fade
- Have both boundaries been touched at least three times and reversed each time?
- Is the range height at least ten times the round-trip fee in percent (for 0.04% maker fees, at least 0.4%)?
- Did the trigger candle close back inside the range?
- Is the stop placed beyond the boundary and the wick, and is it 1R or less?
- What is the fee bill per trade in R? If it is above 0.25R, the setup needs a wider stop or a different timeframe.
- Is the first target at least the midline (2R or better)?
- What will you do on a close outside the range? (The only acceptable answer is "exit".)
Where to go from here
You now have the base method: identify, trigger on a close, stop beyond the wick, target the midline, exit on a close outside. The next two lessons adapt it to the two kinds of range you will meet most often.
- Narrow range scalping: ranges too tight to trade inside, where the only trade is the sweep of the edge.
Related guides:
- Wide range scalping: ranges wide enough for edge trades, midline trades and partial targets.
- Stop hunts and liquidity sweeps: why the wick through the level is part of the setup, not a reason to skip it.
- Bollinger Bands: reading compression before a range breaks.
- Open interest: the positioning signal that warns a range is being loaded for a move.
- Win rate vs risk/reward: why a 50% win rate needs 1.5R wins after fees.
- Crypto scalping strategies: the full strategies track.
- Glossary: range, breakout, expectancy.
This article is educational content, not investment advice. Trading derivatives carries substantial risk, including total loss of capital. See disclaimer.