Crypto Support and Resistance: How to Find Key Levels
TL;DR. A support or resistance level is a price where the market made a decision before: buyers stepped in, sellers capped a rally, a large move started or ended. That decision leaves resting orders and positioned traders behind, and they drive behaviour at the same price the next time it is visited, until enough new flow overrides them. Crypto support and resistance levels are zones rather than lines, they weaken as they are tested, and they change sides when they break. The limitation is that every level eventually gives way, so the useful question is never "will it hold" but "what does my trade do if it does not".
Prerequisites for this lesson: How crypto prices move (why orders cluster), Trade execution (limit orders at a level). Lesson 4 of the basics section.
What a level is
Every price on a chart has a history. At some of them, enough buyers or sellers acted to cause a visible reaction: a bounce, a reversal, the start of a move. The traders involved remember it, and so does the order book, because limit orders tend to be placed at prices that mattered before.
A support level is a price where buying interest has been strong enough to stop or reverse a decline. A resistance level is the mirror: selling interest strong enough to cap an advance. The mechanism is unfilled orders and positioned traders. When BTC rallied from $95,000 to $105,000, some of the traders who missed it placed buy limits back at $95,000 for a second chance. When price returns, those orders are waiting, and that resting demand is what makes the level hold. Practitioners writing on trading regimes describe the same thing in terms of psychology: the traders who sold at a previous low and were relieved to get out flat, the buyers who see value at a previous low, all act at the same place.
Zones, not lines
Levels are zones. The exact price matters less than the band around it, because the resting orders that make a level work are spread across a range of prices, and price only needs to reach that range to activate them.
The width scales with the timeframe and the instrument. On a 1-minute BTC chart a meaningful zone is $100 to $300 wide; on the daily chart the same idea spans $1,500 to $3,000. A thin line that price must touch to the tick is a source of avoidable losses; a zone that price has or has not entered is the practical tool.
Three touches that confirm
A level seen once is a hypothesis. Twice, a coincidence. A third test of the same zone that holds is a pattern that other participants have noticed and are acting on.
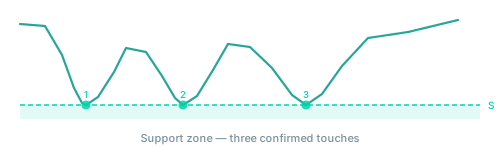
Each time price returns and holds, more traders are watching the level and more orders are placed there. Part of what makes a level work is that it is common knowledge. That is also what makes the obvious level dangerous, as the next section explains.
Each test consumes the level
The part most explanations skip: each test of a level uses up some of the orders that made it hold. When price reaches $95,000 and bounces because of resting bids, those bids are filled and gone. The next visit meets less defence.
A level that has held five times is not necessarily stronger than one that held once; it may be worn thin. A single decisive hold, a long lower wick on heavy volume, often has more unfilled demand behind it than five quiet bounces. When judging a level, ask how decisively it held, not only how often. The trading ranges lesson lists "touches closer together with shallower bounces" among the signs that a range is about to end for exactly this reason.
Role reversal: a level changes sides
After a decisive break, the price that was support tends to act as resistance, and the reverse. This is role reversal, and it is one of the most useful patterns in level trading.
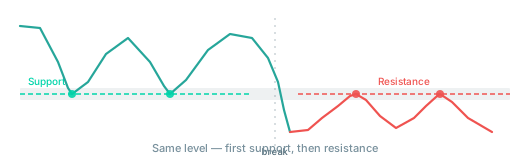
The reason is the trapped side. Buyers who entered at $95,000 support watched the level hold, then break to $92,000. They are holding a loss, and their goal is now to get out flat, which means selling if price recovers to $95,000. That concentrated wish to exit at breakeven is selling pressure at the old support, and it turns the level into resistance. The mirror holds for resistance that becomes support: shorts trapped by an upside break buy back at the old level when price returns.
Role reversal is most reliable after a clean break that left participants trapped, not a slow grind through the level. The more trapped the losing side, the stronger the new role. The range breakout mechanics lesson follows the handover at the order-book level, and the breakout and retest lesson trades it.
The space between levels
Levels are half the picture. The character of the space between two levels tells you how price will travel across it.
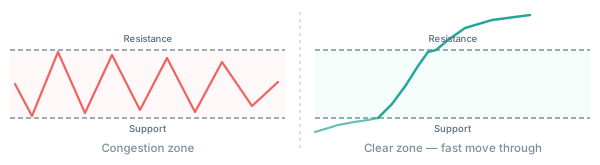
Congestion zones are stretches where price has spent a long time grinding back and forth. The chart looks messy, and it tells you that resting orders exist throughout the space, not only at the boundaries. Price has to work through layers of opposing orders; movement is slow, choppy and prone to reversal, and scalping through the middle of it pays spread and fees against resistance with no clear origin. The narrow range lesson prices that mistake.
Clear zones are the opposite: stretches that price crossed in a single strong candle or a short run of momentum candles, with no pullbacks. There is little historical order density there, and when price enters the zone again it tends to cross it quickly. The consequence for a scalper: when a level breaks into a clear zone, the next level is reached faster than the spacing suggests; when price is grinding through congestion, the move comes slowly.
What adds weight to a level in crypto
- Round numbers. $95,000, $100,000, $105,000 attract limit orders, stops and options strikes because everyone uses them as reference points. A round number that coincides with a prior swing high or low carries both weights.
- Options strikes. Large open interest at a strike on Deribit, especially near a weekly or monthly expiry, adds a hedging-driven pull that a purely chart-derived level lacks. The max pain and gamma exposure lessons explain the mechanism and its limits.
- Timeframe confluence. A level that is visible on the 1-hour, 4-hour and daily charts has more participants acting on it than one visible only on the 5-minute chart.
- High-volume nodes. Prices where a disproportionate amount of volume changed hands, visible on a volume profile, are places where both sides hold positions at cost and react when price returns.
Reading levels across timeframes
Build the map top-down:
- Daily chart. Major swing highs and lows, prominent consolidation ranges. These are the heavy levels; they set the backdrop and are not for timing entries.
- 1-hour chart. Levels relevant to the session: yesterday's high and low, the overnight range, the levels where today's price has already reacted.
- 5-minute chart. The tactical grid: the recent local highs and lows from the last few hours.
The hierarchy matters. A long setup on the 5-minute chart just below a daily resistance zone has a ceiling it did not create; knowing the ceiling is there stops you holding through the reversal that the higher timeframe already predicted. The timeframes lesson covers the pairing.
What levels cannot do
- They break. Enough directional pressure overcomes any level. Plan the trade for the case where it does not hold, with the stop that the position sizing lesson sizes from.
- They get swept. Price piercing a known level and reversing sharply is among the most common events in liquid crypto markets, because the stops and entries clustered there are a pool of market orders. One candle through the zone that closes back inside is not a break; a break is a close beyond the zone that is accepted and, ideally, retested from the other side. The stop hunt lesson separates the two.
- They are overridden by events. A macro shock, a regulatory headline, an exchange failure: the book empties, liquidations take over, and every level on every timeframe is irrelevant until the flow settles.
Where to go from here
You can now mark a level, judge its strength, and read the space between levels. The next lesson is the tool that makes trading at those levels dangerous or survivable depending on how it is used.
- Crypto leverage explained: margin, liquidation distance, and why the stop must come before the liquidation price.
Related guides:
- How crypto prices move: why levels attract price.
- Trading ranges: levels as the edges of a balance area, with the liquidity map.
- Order book and DOM: the resting orders that make a level visible as it forms.
- Breakout and retest: trading a level that has changed sides.
- Crypto scalping basics: the section hub.
- Glossary: support, resistance, breakout, liquidity sweep.
This article is educational content, not investment advice. Trading derivatives carries substantial risk, including total loss of capital. See disclaimer.