How to Trade Crypto Range Breakouts and Avoid Fakeouts
TL;DR. A range breakout is the moment the resting orders at an edge stop absorbing the traffic against them: the stack is consumed, the stop band beyond it fires, and price steps into a part of the book where there is almost nothing to stop it. Up to that point a breakout and a fakeout are the same event. What separates them is what happens next: whether genuine buyers (or sellers) arrive to take the other side of the forced orders, whether price is accepted beyond the level, and whether the level holds when price comes back to test it from the new side. Crypto range breakouts are violent because the same stop band that makes sweeps possible makes real breaks fast. This lesson is the mechanism at the order-book level; the range breakout and breakout and retest lessons are the trades.
Prerequisites for this lesson: Trading ranges (the liquidity map: stacks inside, stops outside), Order book and DOM (depth, absorption, what a market order does to a thin book), Open interest (what a change in OI counts). Lesson 3 of the market mechanics section.
The edge, one minute before
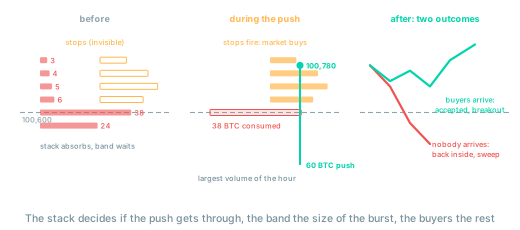
Take the range from the previous lesson: support $99,400, resistance $100,600, three hours old, the swings narrowing. At the resistance edge the book looks like this: a stack of asks at and just below $100,600, say 38 BTC at the level and 20 to 30 BTC per level beneath it, placed by the traders who fade the top; above the level, 3 to 6 BTC per level, because anyone who wanted to sell above resistance sold at it; and, invisible in the book, a band of stop orders from $100,650 to $100,800 that adds up to more than a hundred BTC of market buys waiting for a trigger.
That arrangement is the whole story of what follows. The stack decides whether the push gets through. The band decides how violent the first seconds are. Neither decides whether the breakout is real.
The first thirty seconds: identical either way
A burst of market buying arrives: 60 BTC in a few seconds, from a large order, a news headline, or the market leader moving. The first 38 BTC consume the stack at $100,600. The rest lifts price into the thin zone, and the first stops fire. Their buying lifts price into the next stops. For twenty or thirty seconds the move is self-feeding: the 1-minute candle prints the largest volume of the hour and a wick to $100,780.
Every breakout starts this way, and so does every fakeout. Al Brooks, whose books on price action are the most thorough treatment of this sequence, is blunt that most breakout attempts from a trading range fail, and equally clear that when a breakout is strong the market usually follows through for many bars. The first candle cannot tell you which you are watching. The next two can.
What decides it: who arrives after the band is empty
Once the stops are spent, the buying that came from them stops. Nobody in the band wanted to own BTC at $100,750; they were closing shorts or being closed. The question is whether anyone else does.
Nobody arrives. The sellers who stacked the edge are still there, some of them now above the level, and the breakout buyers who chased the wick have a losing position and a stop below the level. Price drifts down, the level is recrossed, the chasers exit, and the range has pulled price back into its middle. That is the sweep, and the stop hunt lesson gives its tells: a close back inside on the next candle, volume that dries up after the burst, heavy aggression that made no progress.
Buyers arrive. In the two minutes after the burst, another 150 BTC of market buying comes in, not from stops but from participants who want to own BTC at the new price: momentum systems, traders who were waiting for the level to give way, shorts who decide the range is over and cover at market. Sellers who try the old level are absorbed. The book refills above the level, thinly at first, then with size. The candle closes at $100,750 with a full body and the next candle holds above $100,600.
The tape shows the difference before the chart does. In the sweep, aggressive buy volume climbs while price stalls: the buying is being sold to. In the breakout, aggression and progress move together, and the order flow lesson shows how to read that on a footprint.
Acceptance: the level changes sides
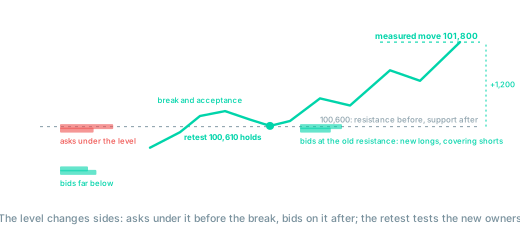
A breakout is not complete when price is above the level; it is complete when price is accepted there. Acceptance means two or three candles that hold beyond the old edge, with pullbacks that are met by buyers rather than by the old sellers. Mechanically, the traders who stacked asks at $100,600 have either been filled and are now short under water, or have pulled their orders. The traders who were short from inside the range are covering into every dip. New longs are placing bids at the old resistance, because it is the obvious place to buy the first pullback.
That last group is the reason the retest works. When price returns to $100,600 from above, it meets bids where an hour ago it met asks. The level has changed hands, and the retest is the test of whether the new owners defend it. If they do, the breakout has passed the last check and the breakout and retest entry is the cleanest way in: a smaller stop below the retest low, the same target as the momentum entry, and the extra evidence before your money is at risk.
How far it goes: the measured move
The compression inside a range stores a certain amount of energy: the traders who faded it, the stops they placed, the positions built while nothing happened. The breakout releases it, and the first estimate of how far is the height of the range projected from the broken edge: $1,200 above $100,600, or $101,800. It is a calibration drawn from what the market has already shown it can travel, not a prediction, and it is where the range breakout lesson puts the first target. Beyond it, the next level on the higher timeframe is the next reference, and the trends lesson covers what the market has become by then.
Open interest and the direction of the fuel
Open interest counts contracts, and every contract has a long and a short. A rise in OI on the breakout candle says new positions were opened on both sides: someone bought the break and someone sold to them. Read with the tape, that becomes useful. If the aggressors were buyers (trades at the ask, delta positive) and price accepted the new level, the new shorts are the ones under water, and their covering is the fuel for the move to the measured move. If OI fell through the breakout, the buying was mostly shorts closing, and there are fewer trapped positions to power the continuation; the breakout can still work, but it has less behind it.
The old version of this idea, that rising OI means new longs and falling OI means a squeeze, is half right. OI says how many positions changed; the tape says who was aggressive; acceptance says who was right.
The rules that follow from the mechanism
- The two-candle rule. On the 1-minute chart, two consecutive closes beyond the edge before the breakout is treated as real; on the 5-minute chart, one full-bodied close. One candle is the burst; the second is the evidence that buyers arrived after it.
- A close back inside ends the trade. Not the stop, the close. Price back inside the range means the pull of the range has won, and the traders who bought the break are about to become the sellers. Exit on that candle and, if the setup is there, consider the reversal.
- Never add to a fade against a confirmed break. The stack that held the range for three hours is gone. Adding to a short above a level that has been accepted is buying a place in the next cascade; the mistakes lesson has the arithmetic.
- Let a range trade become a trend trade only by plan. A short taken at the top of the range that reaches the bottom has done its job. If the bottom then breaks, the remainder can be trailed into the new trend, but only if the plan said so before the entry, with the stop trailed behind the 5-minute swing highs. That is the trailed quarter in the wide range lesson's ladder, not a bet placed after the fact.
The traps
- Buying the wick. The spike is the stop band firing. It is the moment of maximum forced buying and minimum information.
- Market orders into the thin zone. Above the level the book is a few BTC per level. A market order for size fills three or four levels deep, and on smaller coins the slippage can exceed the intended stop distance.
- Reading OI alone. Both sides, always. Direction comes from the tape and from acceptance.
- Believing the retest is guaranteed. Strong breakouts sometimes do not come back. The retest trader misses those, which is the price of the smaller stop; the momentum trader catches them, which is the price of the bigger one. Both prices are fine as long as they are chosen in advance.
- Trading the breakout of a range that never compressed. A wide, expanding range that breaks is more likely to be another swing than a new trend. Crabel's contraction principle runs the other way: the best expansions come from the tightest contractions.
Where to go from here
You now have the breakout as a sequence: stack consumed, band fired, buyers arrive or not, acceptance, the level changes hands, the retest, the measured move. The next lesson is what the market becomes when the sequence completes.
- Identifying and trading crypto trends: market structure, why trends persist, and the signs that one is ending.
Related guides:
- Range breakout: the momentum entry, the four strength conditions, the exit on a close back inside.
- Breakout and retest: the later entry at the level that changed hands.
- Stop hunts and liquidity sweeps: the other outcome of the burst.
- Order flow and DOM: reading absorption and aggression on the tape during the break.
- Position sizing and risk management: why momentum entries are sized down.
- Crypto market mechanics: the section hub.
- Glossary: breakout, measured move, liquidity sweep, open interest.
This article is educational content, not investment advice. Trading derivatives carries substantial risk, including total loss of capital. See disclaimer.