Crypto Open Interest Explained: How to Read OI with Price
TL;DR. Open interest (OI) is the number of futures contracts currently open, and every one of them has a long and a short. A change in OI therefore tells you whether positions are being opened or closed, not which side opened them: rising OI on a rally means new longs were created and new shorts were sold to them. The direction comes from price and from the tape; OI supplies the fuel gauge. Read that way, crypto open interest separates a move financed by new positions from one running on positions leaving, which is the difference between a trend and a squeeze. The trap is reading OI alone and calling a rise "new longs", which is exactly half the story.
Prerequisites for this lesson: Perpetual futures (what a contract is), Funding rates (the other half of the positioning picture), Order book and DOM (aggressor volume and CVD). Lesson 6 of the market mechanics section.
What open interest counts
A futures trade needs a buyer and a seller. What it does to open interest depends on what each of them was doing:
| Buyer | Seller | Change in OI |
|---|---|---|
| Opens a new long | Opens a new short | +1 contract |
| Closes an old short | Closes an old long | −1 contract |
| Opens a new long | Closes an old long | unchanged: the position changed hands |
| Closes an old short | Opens a new short | unchanged |
OI is the stock of open contracts at a moment; volume is the flow of trades over a period. Ten thousand contracts can trade in an hour and leave OI unchanged if every trade was one participant replacing another. The question OI answers is not "how much traded" but "are there more positions open than before, or fewer".
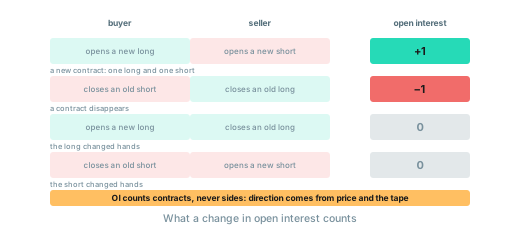
One consequence is easy to state and constantly forgotten: OI is not directional. A rise of 2,000 BTC in open interest means 2,000 BTC of new longs and 2,000 BTC of new shorts. Which side was aggressive, which side was wrong, and which side is now trapped are questions that OI cannot answer. Price, the tape and the funding rate answer them.
Reading OI with price
The classic futures reading, set out by Kenneth Shaleen in Volume and Open Interest decades before crypto existed, pairs the change in OI with the direction of price:
| Price | OI | What happened | What it says about the move |
|---|---|---|---|
| Rising | Rising | New positions opened; buyers were the aggressors, new shorts sold to them | Financed: the shorts who are wrong will pay the longs who are right |
| Rising | Falling | Positions closed; shorts bought back, longs sold to them | Short covering: buying that ends when the last short has covered |
| Falling | Rising | New positions; sellers aggressive, new longs bought from them | Financed downtrend |
| Falling | Falling | Positions closed; longs sold out or liquidated, shorts covered into them | Capitulation: selling that ends when the last forced long is out |
Shaleen's image is fuel. The losing side is what pays the winning side, so a trend needs a supply of new losers to keep going. Rising OI with a trend means the fuel is being replenished; falling OI with a trend means the trend is running on what is left, and, in his phrase, on borrowed time.
The two rows that matter most to a scalper are the first two. A rally with rising OI has new participation on both sides and the aggressor is the buyer; the new shorts are the fuel. A rally with falling OI is shorts leaving; it can be sharp, because a squeezed short buys at any price, and it is over the moment the squeeze is complete. James Dalton calls these new business and old business, and warns that trend traders who do not tell them apart buy the top of every short-covering rally.
OI with the tape: who was aggressive
The missing half of the OI reading is supplied by aggressor volume, the delta and CVD described in the order book lesson. Trades at the ask are market buys; trades at the bid are market sells. Combine:
- OI up, delta strongly positive, price up. New positions, buyers taking the offer, sellers passive. The buyers moved price; the passive sellers are the new shorts. If price holds, the shorts are wrong and will cover: fuel for continuation.
- OI up, delta strongly positive, price flat. New positions, buyers taking, and yet no progress. The passive side is absorbing everything the buyers send. This is the signature of absorption at a level, and of a sweep in the making: if price then reclaims the level, the aggressive buyers are the trapped side.
- OI down, delta positive, price up. Shorts covering into longs taking profit. Old business. Expect it to stop when the covering stops.
The stop-hunt reversal lesson uses the second case to size the fuel behind a reversal, and the order flow lesson shows the tape side in detail.
OI and funding together
Funding says which side is crowded; OI says whether the crowd is growing.
- Rising OI, rising price, rising positive funding. A crowded long that keeps growing and keeps paying to hold. The liquidation prices of those longs stack below the market, and the liquidations lesson describes what happens when price reaches them. This is the combination that precedes the largest cascades.
- Rising OI, rising price, neutral or negative funding. New longs entering without a crowded side, at low carry cost. The most constructive reading for a continuing trend.
- Falling OI, falling price, funding turning negative. Longs have been flushed, shorts are now paying. The fuel for the decline is leaving, and a squeeze the other way becomes more likely.
What OI alone does not tell you
- The level is not the signal; the change is. A high absolute OI says the market is active. Whether that is bullish or bearish depends on how it is changing with price.
- It counts contracts, not people, and not sides. For the balance between longs and shorts, exchanges publish long/short account ratios and top-trader position ratios, which are separate data with their own limitations.
- It differs by venue. Binance can show rising OI while Bybit is flat. The venue whose OI moves first is often the one where price discovery is happening; the divergence is information.
- It is reported with a lag on some feeds. Aggregators poll exchanges every few seconds to minutes. For a scalp, the tape leads OI; use OI to classify the move, not to time it.
OI at breakouts and sweeps
Two moves through the same level can look identical on the price chart and be different in OI:
- OI rises through the break, price is accepted beyond the level. New positions on both sides; the aggressors won; the new shorts are trapped. A financed breakout, and the range breakout mechanics lesson follows what happens next.
- OI rises through the spike, price closes back inside the level. New positions on both sides; the aggressors lost; the new longs are trapped above the level and their exits are the fuel for the reversal.
- OI falls through the break. The move was mostly positions closing: stops and liquidations of the wrong side. Fewer trapped positions remain to power a continuation, whichever way price goes next.
The chart shows the move. OI says whether positions were opened or closed. Acceptance says who was right.
Practical application for scalpers
Before a breakout entry. Check that OI is rising with the move and that the tape shows the aggressors on your side. Falling OI on a breakout means a squeeze; take the measured move and do not expect more.
After a sharp decline. Falling OI with falling price is longs leaving. When the rate of decline in OI slows and volume dries up, the forced sellers are nearly exhausted; that is where the liquidations lesson's reversal conditions start.
In a quiet range. OI building steadily for hours while price barely moves means a large open position is waiting to be resolved. The ranges lesson lists it among the signs that a range is about to end, and the move when one side gives up is usually fast.
For sizing, not for triggers. OI classifies the move; the entry comes from structure. Confirmation from OI raises the size of a trade; contradiction lowers it or cancels it.
Where to find OI data
- CoinGlass: aggregated OI across major exchanges, free, with a few seconds to a minute of lag.
- Binance REST API:
GET /fapi/v1/openInterest?symbol=BTCUSDT, per venue, updated every few seconds. - Deribit WebSocket:
ticker.BTC-PERPETUAL.raw, fieldopen_interest, real time. - TradingView: OI as a panel below the chart for supported instruments.
Where to go from here
OI shows the positions building; the last lesson in this section is what happens when they are unwound by force.
- Liquidations: how the liquidation engine works, why cascades self-reinforce, and how to read one in real time.
Related guides:
- Funding rates: the price of the crowded side.
- Order book and DOM: aggressor volume and CVD, the direction that OI lacks.
- Stop-hunt reversal: using OI to size the fuel behind a reversal.
- Trade exit strategy: OI falling on new highs as the signal to tighten a trail.
- Position sizing and risk management: confirmation as a size input.
- Crypto market mechanics: the section hub.
- Glossary: open interest, CVD, delta, funding rate.
This article is educational content, not investment advice. Trading derivatives carries substantial risk, including total loss of capital. See disclaimer.