How to Identify and Trade Crypto Trends
TL;DR. A trend is a sequence of higher highs and higher lows (or the reverse) on a stated timeframe, and it persists because of a feedback loop: momentum buyers add, trapped shorts cover, new positions finance the move, and pullbacks are bought at the crowd's average entry, which is what a rising moving average measures. Identifying crypto trends is a question of structure, not of indicators, and the same structure tells you when the trend is over: the first close below the last higher low. The trap is the timeframe. A trend on the 5-minute chart is a swing inside a range on the 1-hour chart, and a trader who does not name the timeframe will fade a trend and chase a range on the same afternoon. This lesson is the mechanism; the trend scalping lesson is the trade.
Prerequisites for this lesson: Range breakout mechanics (how a trend starts), Open interest and funding rates (the positioning data that shows a trend being financed), EMA scalping (the moving average used as dynamic support). Lesson 4 of the market mechanics section.
Structure first, indicators second
Charles Dow's definition has not been improved on in a century: an uptrend is a series of higher highs and higher lows, a downtrend a series of lower lows and lower highs. It is the cleanest definition because it is made of prices that everyone can see and nobody can argue with. A moving average sloping up is a consequence of the structure, not a substitute for it.
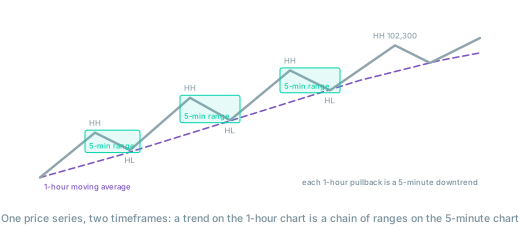
The definition comes with a condition that most tutorials skip: the timeframe. James Dalton's line in Markets in Profile is that a trend to a scalper is of no consequence to a long-term investor, and a series of higher highs on the 30-minute chart can be noise inside an intermediate bracket. On BTC, a 5-minute uptrend of $1,200 is often one swing of a 1-hour range. Name the timeframe before you name the trend, and pair the entry chart with the chart one or two steps above it, as the timeframes lesson describes.
Why trends persist
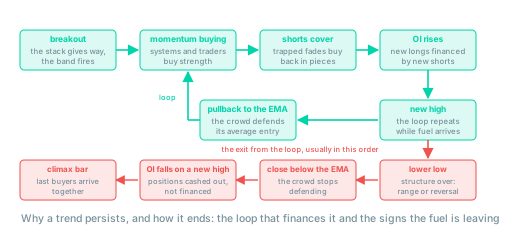
A range holds because both sides absorb; a trend persists because one side keeps taking and the other keeps giving way. Several mechanisms drive it at once, and they reinforce each other.
Momentum buyers. Systems and traders whose rule is to buy strength buy each new high. Their buying is genuine, and it stops only when a new high fails.
Trapped shorts. The traders who faded the range top are short under water. Brooks describes the relentless trend day precisely: the bears keep waiting for a strong reversal signal so they can short with size, the trapped longs (in a bear trend) keep waiting for evidence that they must exit, and neither signal comes, so both sides keep selling in pieces all day. In an uptrend the roles reverse: shorts cover in pieces on every push, and their covering is buying.
New positions financing the move. Open interest rises through a healthy trend: new longs are opened and new shorts are sold to them. The classic futures image is fuel. The shorts who sell into the trend and are wrong are what pays the longs who are right; as long as new shorts keep arriving, the trend is being refuelled. When OI rises with price and funding turns positive, longs are paying to hold, which is the market charging rent for a crowded side and the first hint of where the trend will eventually run out.
The moving average as the crowd's entry. A 20-period EMA on the 5-minute chart is a running average of where the last hundred minutes of trading happened. In an uptrend it rises because the crowd's average entry rises. A pullback to it is a pullback to the crowd's breakeven, where the traders who bought the last leg defend their position and the traders who missed it buy the discount. That is all "dynamic support" means; there is no property of the line itself.
Psychology at the old levels. Traders who sold at the previous high and watched price go higher are relieved to get out flat when price returns there; traders who missed the previous low see value there. The behavioural explanation for why old highs become support in a trend runs through fear and relief, not through geometry.
What a trend looks like on the day it happens
Crypto has no opening bell, but the shape of a trending session is the same as the one Toby Crabel and Brooks documented in futures: price makes one extreme early, travels most of the session in one direction with small pullbacks, and closes near the opposite extreme. Crabel defined a trend day partly by the first hour containing only a small fraction of the day's range; Brooks puts the strongest version, the trend from the open, at roughly one day in five in the index futures he trades. The proportion is not the point; the shape is:
- Pullbacks are small and brief. Two to five candles, small bodies, back to the moving average and no further. A pullback that lasts fifteen candles and closes below the average is the first sign that the loop is weakening.
- Reversal signals fail. The best-looking reversal candles of a trend day are counter-trend traps. Brooks's observation that a strong bear trend can go all day without a single good sell signal bar explains why beginners short every red candle in a rally and lose on each one.
- The book is thin ahead of price. Liquidity migrates behind the move. Market orders in the direction of the trend fill several levels deep, which is why the trend scalping lesson enters on stop orders above a closed signal bar rather than at market into the run.
- Volume is elevated but not climactic. A trend that is being financed steadily prints steady volume. The largest candle of the day on the largest volume is more often the end than the middle.
When the trend is over
The structure gives the definition and the definition gives the end: the first close below the last higher low. Until that close, pullbacks are pullbacks. After it, the trend on that timeframe is finished, whether a range or a reversal follows, and the pullback-buying strategy loses its premise.
The loop usually shows strain before the structure breaks, and each sign is the reverse of one of the mechanisms above:
| Sign | Mechanism that is failing |
|---|---|
| A climax bar: an unusually large trend candle on the largest volume of the run | The last buyers arriving together; momentum buying is exhausting itself |
| Open interest falling while price makes a new high | Positions are being closed into strength; the move is being cashed out, not financed |
| Aggression fading on the tape: each push on less buy delta, CVD flattening | Fewer participants are carrying the move |
| Pullbacks deeper and longer, closing below the moving average | The crowd's breakeven is no longer being defended |
| Funding at an extreme | The crowded side is paying rent and will be squeezed |
Dalton's distinction between old business and new business belongs here. A rally driven by short covering is old business: positions leaving the market. Once the covering is finished it leaves the market with less buying potential, not more, and the rally reverts. A rally driven by new longs is new business, and it can continue as long as new participants keep arriving. Rising OI with rising price is the signature of the second; falling OI with rising price is the signature of the first, and the trade exit lesson uses exactly that reading to tighten a trailing stop.
Trends and the higher timeframe
A 5-minute uptrend running into a 1-hour resistance zone is a trend that is about to meet the stack the ranges lesson described. The 5-minute structure is intact until the lower low; the 1-hour context says the lower low is likely soon. The practical consequence for a scalper is size, not direction: trade the 5-minute trend with the 5-minute rules, and trade it smaller as it approaches the level above. The reverse case, a 5-minute uptrend inside a 1-hour uptrend that has just broken out, is where the pullback strategy has its best record, because the loop is running on both timeframes at once.
Execution in a trend
A trending market is where execution costs show up. The book ahead of price is thin, so a market order to join the move fills through several levels; a market order to exit a losing counter-trend position fills worse still. The trade execution lesson covers the mechanics; the rule that follows from this lesson is that entries in a trend are placed on pullbacks with stop or limit orders at levels chosen in advance, never at market into a running candle.
One structural warning belongs with this. On an exchange with a public order book, a fast trend is a market event that everyone can read. On a B-book broker or a CFD "kitchen", the counterparty to your position is the broker, which can widen its own spread during a spike and fill your stop at a price that never printed on any exchange. Reading trends the way this lesson describes requires a venue where the book is real; the exchanges section explains how to tell.
The traps
- Fading the trend because it has gone far. "Too high" is not a level. Until the lower low, every new high is the loop working. The counter-trend short in a strong trend has the worst equation in this section.
- Confusing a squeeze with a trend. Rising price on falling OI is shorts leaving. It looks like a trend and ends when the last short has covered. Check the OI before calling it new business.
- Trading the trend on the wrong timeframe. A 1-minute "trend" lasts fifteen minutes and reverses on a sweep. Define the trend on the 15-minute or 1-hour chart, enter on the 5-minute.
- Adding to a position instead of trading a second one. Averaging up turns three good pullback trades into one large position at the top; the trend scalping lesson has the rule that keeps open risk at 1R.
- Holding through the lower low. The structure said the trend was over. Hoping it resumes is the same error as averaging down in a broken range, and the risk of ruin lesson prices it.
Where to go from here
Ranges, breakouts and trends are the three states of price, and you can now describe each as a mechanism. The remaining lessons in this section cover the positioning data that runs underneath all three: funding, open interest and liquidations.
- Funding rates: the rent a crowded side pays, and what it signals.
Related guides:
- Trend scalping with EMA pullbacks: the trade this lesson supports, with numbers.
- Range breakout mechanics: how the trend starts.
- Open interest: new business versus old business in one number.
- Trade exit strategy: trailing a trend trade and reading the fuel gauge.
- Position sizing and risk management: sizing down as a trend approaches a higher-timeframe level.
- Crypto market mechanics: the section hub.
- Glossary: trend pullback, open interest, EMA, funding rate.
This article is educational content, not investment advice. Trading derivatives carries substantial risk, including total loss of capital. See disclaimer.