Crypto Trading Ranges Explained: Structure, Liquidity & Traps
TL;DR. A trading range is a two-sided auction: buyers defend a floor, sellers defend a ceiling, and price rotates between them because neither side has new information to push with. Crypto trading ranges form after a move has run out of aggressors, they hold as long as the resting orders at the edges absorb the traffic, and they end when that absorption is exhausted. The liquidity is arranged in a specific way: limit orders inside the range near the edges, stop orders in a dense band just outside them, and almost nothing beyond. That arrangement is why the edges get poked, why the pokes usually fail, and why the middle is where beginners bleed. This lesson is the mechanism; the strategies track has the trades.
Prerequisites for this lesson: Order book and DOM (bids, asks, depth and what resting size means), Support and resistance (why the same prices matter to everyone), How crypto prices move (aggressors and passive orders). Lesson 2 of the market mechanics section.
A range is a market that has stopped arguing
Every price move is one side taking liquidity from the other. A trend is a stretch where one side keeps taking; a range is a stretch where both sides take a little, in turns, and neither gets anywhere. The auction-market school that grew out of James Dalton's work on Market Profile calls this balance: a market whose profile is symmetrical is a market that has agreed on a price area and is waiting for new information before it goes anywhere else.
That waiting is the normal state. It is common to read that markets range most of the time; the figure changes with the timeframe and the period measured, so treat it as an observation rather than a statistic. What is true on every timeframe is that a range on one chart is a trend on a smaller one and a pause on a larger one. A three-hour BTC range on the 5-minute chart is a single candle on the daily. Before you call anything a range, name the timeframe.
How a range forms
Ranges form after trends, and the transition has a recognisable sequence:
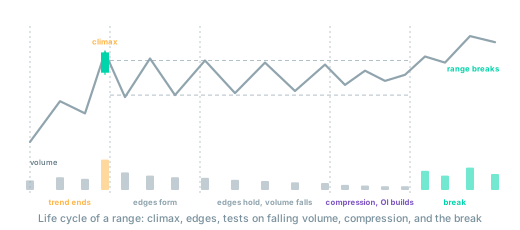
- The move runs out of aggressors. The buyers who chased the rally have bought; the shorts who were squeezed have covered. The last impulse is often a large candle on the largest volume of the move, the climax that the trends lesson describes.
- Profit-taking meets new interest. Longs sell into the high; buyers who missed the move bid the first dip. The first swing down and the first swing back up mark the edges.
- The edges get tested and hold. Each return to the high meets the same sellers, each return to the low meets the same buyers. After the third touch on each side, the levels are known to everyone with a chart, which is what makes the fourth touch work and the fifth crowded.
- Volume falls and the swings narrow. The participants who wanted to trade at these prices have done so. The middle of the range fills in with volume; the edges thin out.
At that point the profile of the range has its characteristic shape: a fat middle where most of the volume traded, thin edges where price spent little time, and a point of control near the centre.
Where the volume is and where the liquidity is
Two different maps describe a range, and beginners confuse them.
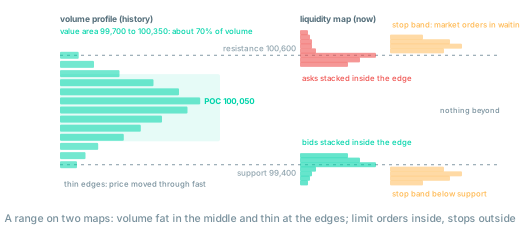
The volume profile is history: how much traded at each price. In a BTC range between $99,400 and $100,600 over three hours, the point of control might sit at $100,050 and the value area, the band that holds about 70% of the volume, run from $99,700 to $100,350. The edges outside the value area are low-volume nodes: price moved through them fast and did not linger. That is why price also tends to move through them fast on the way back, and why a trade entered in the middle of the value area has no reason to expect a quick move anywhere.
The liquidity map is the present: where the resting orders are now. Inside the range, bids stack up just above support and asks just below resistance, placed by the traders who intend to fade the edges. Outside the range, the picture inverts. There are few resting limit orders beyond the edges, because anyone who wanted to sell above resistance would have sold at resistance, but there is a dense band of stop orders: the stops of the fades, the entry stops of the breakout traders, and the liquidation prices of the leveraged positions. Stops are market orders in waiting. The order book does not show them, and the book beyond the edge looks empty, which is exactly why it is dangerous.
Why the edges get poked and why the pokes fail
Put the two maps together and the behaviour of a range at its edges follows without any villain.
Price approaches resistance. The asks stacked below the level absorb the buying; if they are enough, price turns back and that is the ordinary fade. If a burst of buying is larger than the stack, the last asks are consumed and price steps into the thin zone above, where the first stops sit. Those stops fire as market buys, lift price into more stops, and for a few seconds the move feeds itself. Larry Harris's description in Trading and Exchanges fits crypto without modification: stop orders demand liquidity at the moment it is scarcest and accelerate the move that triggered them.
Then the band is empty. Nobody in it wanted to own BTC at $100,150; they were closing shorts or being closed. If no genuine buyers step in above the level, there is no bid underneath the new price and it falls back through the level as fast as it rose. The traders who bought the breakout are now long above a level that is closing under them, and their exits are the first wave of selling on the way down. That is the sweep, and it is the most common single event at the edge of a crypto range. The stop hunt lesson covers how to recognise it while it is happening and the reversal lesson trades it.
Three kinds of participant push into the band, and the chart cannot tell them apart: large traders who want the stop band's liquidity to fill against, the exchange's liquidation engine closing leveraged positions whose margin ran out, and breakout algorithms buying the new high. The result is the same whichever dominated. What decides the outcome is not who pushed but whether anyone arrives to take the other side once the forced orders are spent.
The middle of the range
Inside the value area, price is where most participants agree it should be. Moves there are small, two-sided and quick to reverse, because every push meets a resting order a few dollars away. The narrow range lesson works the arithmetic: in a $150 band the round-trip fees on BTC are $40 with limit orders and $100 with market orders against a target that is at most $100 away, so the middle of a tight range is a place where the exchange makes money and nobody else does. In a wider range the middle is still the lowest-information part of the chart: nothing is being defended there and nothing is being broken.
Volume confirms the point. Heavy two-sided trading in the middle of a range is not absorption; it is the auction doing its job. Absorption, the signature of a level being defended, is heavy one-sided aggression at an edge that makes no price progress, and it means something only at the edges.
When a range is about to end
A range holds while the resting orders at its edges absorb the traffic and the pokes fail. It ends when the absorption is exhausted or when new information arrives, and there are readable signs of both:
| Sign | What it means mechanically |
|---|---|
| Volume rising into a boundary instead of falling | Aggressors are pressing the level rather than fading it; the stack is being consumed faster than it is refilled |
| Touches closer together with shallower pullbacks | Each visit has removed some of the resting orders; the level is being ground down |
| Open interest rising through the range | New positions are being built inside the range, not recycled; someone intends to move price |
| Funding at an extreme | The range is crowded on one side and the crowd will be squeezed |
| The swings narrowing to a band of 0.1% to 0.2% | Compression; Crabel's contraction that tends to precede expansion |
| A scheduled release or a large options expiry ahead | New information is timetabled, and the range is waiting for it |
Dalton's observation about balance areas applies to crypto with more force than to the markets he wrote about: once price leaves a balance area it tends to move fast and liquidity shrinks, because the same stop band that made the sweep possible makes the real breakout violent. The range breakout mechanics lesson follows that sequence at the order-book level.
The traps
- Trading the middle. No level under you, no level over you, fees on every attempt. The narrow range lesson has the numbers.
- Reading the book beyond the edge as empty. It is empty of limit orders and full of stops. A market order there fills several levels deep and a poke there becomes a burst.
- Calling every wick a manipulation. The poke through the edge is the liquidity map doing what liquidity maps do. It needs no manipulator, and the trader who treats it as one fights the market instead of reading it.
- Fading the fifth touch like the first. Each touch consumes part of the stack. By the fifth visit the edge is weaker, and a close through it is more likely than a reversal.
- Averaging into the breakout. The range that held for three hours has trained you to expect a return. When the close outside comes, adding to the fade is the most expensive habit a range trader has; the risk of ruin lesson shows what a few of those do to an account.
Where to go from here
You can now describe a range as a structure: a balance area with a fat middle, defended edges, a stop band outside, and a small set of signs that it is about to end. The next lesson follows the moment it ends.
- Range breakout mechanics: what happens in the book when the absorption at an edge is exhausted, and how a breakout differs from a sweep.
Related guides:
- Range fade: the base trade inside a range, with the fee test and the exit rule.
- Stop hunts and liquidity sweeps: the edge poke as a trade filter and a setup.
- Order book and DOM: how the resting orders that hold a range are displayed.
- Volume profile: the point of control and value area as chart tools.
- Position sizing and risk management: the stop that keeps a range trader alive when the range ends.
- Crypto market mechanics: the section hub.
- Glossary: range, liquidity sweep, absorption, volume profile.
This article is educational content, not investment advice. Trading derivatives carries substantial risk, including total loss of capital. See disclaimer.