Volume Profile Trading: POC, Value Area & HVN/LVN
TL;DR. A volume profile shows how much traded at each price over a chosen period, drawn sideways on the chart: where, not when. Its three readings are the point of control (the price with the most volume), the value area (the band around it holding about 70% of the volume) and the nodes, high-volume where the market accepted a price and low-volume where it rejected one. For a scalper, volume profile trading is a map of where a level has substance behind it and where price will travel fast; it complements VWAP and the EMAs and replaces neither. The limitation is the period: a profile is only as meaningful as the session or range it was built from, and a point of control from a thin hour is not a level.
Prerequisites for this lesson: Trading ranges (balance, the fat middle and thin edges), VWAP (the session's volume-weighted average, which the profile extends), Support and resistance (levels as zones). Lesson 6 of the indicators section.
What a profile shows
A volume histogram at the bottom of a chart shows how much traded in each candle: volume by time. A volume profile rotates the question: how much traded at each price, over the period you choose. The result is a histogram drawn against the price axis. Where the bars are long, a lot of business was done at that price; where they are short, price passed through without stopping.
The idea descends from Market Profile, which J. Peter Steidlmayer developed at the Chicago Board of Trade in the 1980s and James Dalton wrote up as auction theory. Market Profile counts time at each price; volume profile counts contracts. On liquid crypto perpetuals with public trade data, volume is the better of the two, and every major charting platform draws it.
The three readings
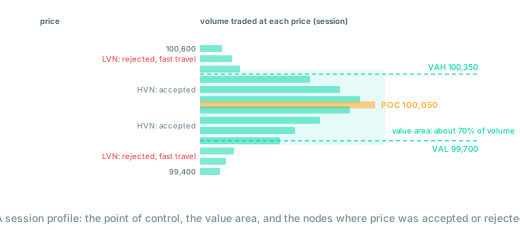
Point of control (POC). The price with the most volume in the period: the level the market agreed on most. In the session profile from the ranges lesson, between $99,400 and $100,600, the POC sits at $100,050. Price tends to return to it while the range holds, because it is where the most positions were opened at cost and where the most participants have a reason to act.
Value area (VA). The band around the POC that contains about 70% of the volume, here $99,700 to $100,350, with its edges the value area high (VAH) and low (VAL). Inside it, price is where most participants agreed it belonged. The 70% is a convention borrowed from one standard deviation of a normal distribution; it is not a law, and some traders draw 68% or 80%. Consistency matters more than the number.
Nodes. A high-volume node (HVN) is a bulge in the profile, a price where trading lingered and positions accumulated: acceptance. A low-volume node (LVN) is a gap, a price that the market passed through quickly and did not want to trade at: rejection. Price tends to slow and rotate at HVNs and to move fast through LVNs, for the reason the support and resistance lesson gives for congestion zones and clear zones: resting orders and positioned traders live at the HVNs and not at the LVNs.
Which profile
The profile depends entirely on the period it is built from, and choosing it is most of the skill.
- Session profile. One trading day, usually from 00:00 UTC on crypto. The intraday map: today's POC, VAH and VAL. Reset daily, like VWAP.
- Fixed-range profile. Drawn over a range you select, such as the three-hour balance of the ranges lesson. This is the profile of a specific auction and the most useful one for range trades.
- Composite profile. Many days combined. Slow to change and good for the heavy levels: a composite HVN is where a lot of positions from many sessions sit at cost, and a composite LVN is where price has repeatedly refused to trade.
- Visible-range profile. Whatever is on the screen. Convenient and dangerous, because scrolling changes the levels.
The profile of the venue you trade is the honest one for scalping, because it is the one whose participants will act at those prices; an aggregate across exchanges smooths venue quirks and is useful for the composite. Row size matters too: rows of $10 on a 1-minute BTC chart show the micro-structure, rows of $100 show the shape; start with the shape.
How scalpers use it
The value area edges as the range. VAH and VAL are the objective version of the range edges that the range fade lesson draws by hand. Price at VAL with a rejection candle is the fade; price accepted below VAL, two or three closes with the profile building there, is the range ending.
The POC as the target. A fade from the value area edge aims at the POC first, because that is where the traffic goes when the range holds. In the session above, a short from VAH at $100,350 targets the POC at $100,050, $300 away.
Price outside value. When price is above the VAH, either the market is repricing (a trend, and the profile will build a new value area higher) or it is an excursion that will be pulled back to value. The tell is the same as in the breakout mechanics lesson: acceptance. A move out of value that holds and builds volume is new value; a move out of value on thin volume that fails to build a node is a return trip.
LVNs as expected fast travel and as the wrong place for a stop. If price breaks below VAL and the profile below it is thin down to the next HVN, expect the move to cover that distance quickly, which sets the target. And never put a stop inside an LVN: it is precisely where price moves fastest and fills worst. Stops go beyond the node, on the far side of the next HVN or the structural level.
Naked POCs. A previous session's POC that price has not revisited since. Traders who opened positions there have not had a chance to act at their cost basis; when price returns, it tends to react. Naked POCs from the last few sessions are targets and reaction points worth having on the chart.
A worked trade
Session profile: POC $100,050, VAH $100,350, VAL $99,700; an LVN from $100,450 to $100,550 above value. Price rallies out of value to $100,480, into the LVN, on volume lower than the morning's, stalls, and a 5-minute candle closes back inside value at $100,320.
| Item | Value |
|---|---|
| Entry (short, on the close back inside value) | $100,320 |
| Stop, beyond the LVN | $100,580 (risk $260) |
| Target, the POC | $100,050: +$270, about 1R |
| Second target, VAL | $99,700: +$620, 2.4R |
| Position for $100 of risk | 0.385 BTC, notional $38,600; maker fees $15 (0.15R) |
Read the first row of targets honestly: from the edge of value to the POC is about 1R here, which is why the fade from the value area edge takes half at the POC and carries the rest to VAL, the same ladder the wide range lesson uses. A profile whose POC is too close to its edges to pay 2R is a profile whose range is too narrow to fade, and the narrow range fee test applies.
Profile shapes
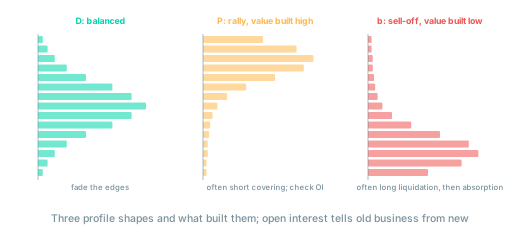
- D shape. Symmetrical, POC in the middle: a balanced session, the two-sided auction of the ranges lesson. The edges are fades until they are not.
- P shape. Thin below, fat above: price rallied and then built value at the top. Dalton's reading in the futures markets is that this shape is often short covering, old business leaving rather than new buying arriving, and that the value built at the top can be a place the market returns to sell. Check with open interest: a P shape on falling OI is covering; on rising OI it is new business.
- b shape. Fat below, thin above: a sell-off that found acceptance low, often long liquidation followed by buyers absorbing it. The mirror of the P, with the same OI check.
- Double distribution. Two fat regions separated by an LVN: the session changed its mind, usually on news, and the LVN between the two value areas is a level that price crosses fast in either direction.
The traps
- A profile from a thin period. The POC of a two-hour Asian session with a tenth of the day's volume is a number, not a level. Weight the profile by the volume it contains.
- Treating the POC as a magnet regardless of context. Price returns to the POC while the auction is balanced. Once it has been accepted outside value, the old POC is a reference for a possible retest, not a target.
- Stops in LVNs. The most common profile mistake and the most expensive; the node is where fills are worst.
- Confusing the visible-range profile with a level. Scroll the chart and the POC moves. Use a session, a fixed range or a composite, and know which one you are looking at.
- Reading the profile instead of the tape. The profile is history: where volume was. Whether a node holds now is answered by the order flow at the node, not by the size of the bar.
Checklist
- Which profile: session, fixed range or composite, and from which venue?
- Where are the POC, VAH and VAL, and does VWAP sit near the POC?
- Is price inside value (fade the edges) or outside it (accepted or an excursion)?
- Where are the LVNs, and is the stop on the far side of one?
- Is the distance from the entry to the POC at least 1R and to the far edge at least 2R after fees?
- Any naked POCs from the last sessions between here and the target?
Where to go from here
You now have five tools from four families: VWAP and the EMAs for trend, ATR and Bollinger Bands for volatility, RSI for momentum, the profile for context. The last lesson of the section is about not using all of them at once.
- Combining indicators: one tool per family, and why the disagreements carry the information.
Related guides:
- Trading ranges: the profile as the shape of a balance area.
- VWAP: the session's volume-weighted average and its bands.
- Range fade: the trade at the value area edges, with the fee test.
- Order flow and DOM: confirming that a node is being defended now.
- Position sizing and risk management: the stop beyond the node and the size from it.
- Best indicators for scalping: the section hub.
- Glossary: volume profile, range, absorption.
This article is educational content, not investment advice. Trading derivatives carries substantial risk, including total loss of capital. See disclaimer.