RSI Divergence Explained: Bullish, Bearish & Hidden Signals
TL;DR. The RSI measures the speed of recent price changes on a scale from 0 to 100. RSI divergence is the case where price makes a new extreme and the RSI does not: the move is being carried by less momentum than the previous one. It is one of the most discussed signals in retail trading and one of the most misused, because on its own it produces more false alarms than reversals; in a strong trend divergence can persist across several swings while price keeps going. At a structural level, in the extreme zone, with a confirming candle, it is useful context. Without those it is noise with a name.
Prerequisites for this lesson: Support and resistance (the level that gives a divergence its context), Single candlestick patterns (the confirmation), Bollinger Bands (the previous lesson). Lesson 5 of the indicators section.
What the RSI measures
J. Welles Wilder published the relative strength index in 1978. Over a lookback of fourteen candles by default, it compares the average size of the up-closes with the average size of the down-closes:
RSI = 100 − 100 ÷ (1 + RS)
RS  = average up-close ÷ average down-close over N candles
Above 70 is called overbought, below 30 oversold, and 50 is neutral. The names are the source of most of the trouble.
Overbought is not a sell signal
In a strong uptrend the RSI sits above 70 for hours or days, and every short taken because it crossed 70 loses. In a strong downtrend it sits below 30 while every long taken at 30 loses. The zones say the market is extended relative to its own recent history, which is context. The signal, in so far as the RSI has one, is divergence.
Divergence
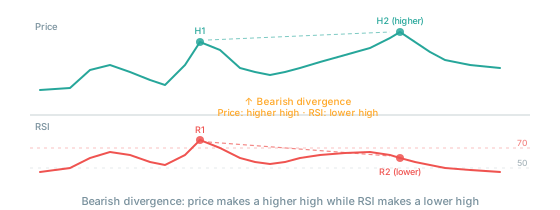
Divergence is price and the RSI disagreeing over the same two swings.
Regular bearish divergence. Price makes a higher high; the RSI makes a lower high. Buyers pushed to a new high with less momentum than the previous push.
Regular bullish divergence. Price makes a lower low; the RSI makes a higher low. Sellers pushed to a new low with less force.
Hidden divergence, the continuation version: in an uptrend, price makes a higher low while the RSI makes a lower low, and the trend tends to continue; in a downtrend, price makes a lower high while the RSI makes a higher high. Hidden divergence is often the more reliable of the two in a trending market, because it agrees with the trend instead of fighting it.
Why divergence alone is not enough
Divergence can persist for many candles before price turns, and price may not turn at all. In a strong trend, bearish divergence appears, price rises, it appears again, price rises again. That is not a defect in the indicator; momentum can fade gradually while price is held up by other things, ongoing short covering, a thin book above, new positions financing the move. The open interest lesson describes what holds a trend up after its momentum has faded.
The failure mode is familiar: divergence appears, the trader shorts, price continues through the stop, three times, and the trader stops trusting the RSI. The RSI did what it does; it was asked to do something else.
Divergence at a level
Divergence is a readiness signal, not a trigger. The trigger is structure.
Bearish divergence is worth acting on when price is at a known resistance, a previous high or a round number; the RSI is in the overbought zone as it forms the divergent high; a bearish candle confirms at the level, a shooting star or a bearish engulfing; and the book shows size resting at or just above the level. Bullish divergence mirrors it: at support or VWAP, RSI in the oversold zone, a bullish candle, selling volume fading.
With all four present the setup is worth a trade with a stop beyond the level. With only the divergence present it is a note in the margin, and the candlestick context lesson's order of operations, level first and pattern last, applies to the RSI as to any pattern.
Settings for scalping
| Chart | RSI period | Overbought | Oversold |
|---|---|---|---|
| 1-minute | 7 to 9 | 75 | 25 |
| 3-minute | 10 to 14 | 70 | 30 |
| 5-minute | 14 | 70 | 30 |
Shorter periods reach the extremes more often and produce more false readings; the fourteen-period RSI on the 3-minute chart is a reasonable start.
Across timeframes
A divergence on the 1-hour chart sets a bias; the 15-minute chart confirms that momentum has turned; the 3-minute chart times the entry. Higher-timeframe momentum filters lower-timeframe entries in the same way that the timeframes lesson pairs charts for structure.
The traps
- Manufactured divergence. Every peak has an RSI reading, and connecting the right ones produces "divergence" anywhere. The peaks must be clear swing points, not intrabar noise.
- Acting on the divergence itself. Wait for the confirmation: a reversal candle, a break of the short-term structure, a turn in the CVD.
- The RSI as the whole system. It measures momentum and nothing else: not trend, not volume, not the book, not positioning. It is one witness from one family, as the combining lesson puts it.
- Fading a financed trend. Bearish divergence with rising open interest is a trend that is still being financed while its momentum fades; that is the exit signal from the exit strategy lesson for a long, not an entry for a short.
Where to go from here
The RSI is momentum. The next lesson is context: volume by price, which shows where a level has substance and where price will travel fast.
- Volume profile: point of control, value area, high- and low-volume nodes.
Related guides:
- Single candlestick patterns: the confirmation that pairs with divergence.
- Candlestick context: level first, pattern last.
- VWAP: the level where bullish divergence carries most weight.
- Trade exit strategy: fading momentum as a reason to tighten a trail.
- Position sizing and risk management: the stop beyond the level.
- Best indicators for scalping: the section hub.
- Glossary: RSI, RSI divergence, support.
This article is educational content, not investment advice. Trading derivatives carries substantial risk, including total loss of capital. See disclaimer.