Single Candlestick Patterns: Hammer, Doji & Shooting Star
TL;DR. Single candlestick patterns are the simplest reversal signals in technical analysis. The hammer, hanging man, shooting star, inverted hammer and doji are all built on one idea: a long wick shows that price was rejected at an extreme, which suggests the move that produced it may be exhausted. They apply at the end of a move, at a level. None of them is a trade on its own; each is evidence that needs a confirming candle, and without that confirmation they fail about as often as they work.
Prerequisites for this lesson: How to read candlestick charts (bodies, wicks, what a close means), Support and resistance (the levels where these patterns count). Lesson 2 of the strategies track.
The logic behind all of them
Every single-candle reversal pattern tells the same story: price tried to move one way and was pushed back. The longer the wick relative to the body, the more decisive the rejection.
At the end of a decline, a candle with a long lower wick means sellers pushed price down during the period and buyers drove it back before the close. That is the fingerprint of demand at that price. At the end of a rally, the mirror: a long upper wick means buyers pushed up and sellers pushed them back. Supply appeared.
Three questions for any single-candle pattern:
- Where is it? At a known level, after a sustained move? Or in the middle of a range?
- How long is the wick? At least twice the body for the rejection to mean anything.
- What did the next candle do? A reversal candle without confirmation is information, not a trade.
Hammer

Appears: at the end of a decline
Signal: bullish reversal
Shape: small body at the top, lower wick at least twice the body, little or no upper wick
The hammer is the most recognised single-candle reversal. It forms at the bottom of a move: price falls sharply during the period, buyers push it back, and it closes near where it opened. The long lower wick is the record of the sellers' failed attempt.
What it means: there is buying interest at this price. The sellers who drove the period were overcome, and the level may be support.
Colour matters a little. A green hammer (close above open) is slightly stronger than a red one, but both are valid. The wick is the signal, not the body colour.
In scalping:
- Look for it at a known support level or after a sustained decline.
- Confirm with the next candle: it should close higher, ideally above the hammer's body.
- Entry above the hammer's high, stop below its low. The range fade lesson uses exactly this trigger at the range low.
Minimum wick: twice the body. A wick barely longer than the body is not a hammer.
Hanging Man

Appears: at the end of a rally
Signal: bearish reversal warning
Shape: identical to the hammer: small body at the top, long lower wick
The hanging man looks exactly like the hammer. The name and the meaning change with the location: after a decline it is a hammer and bullish; after a rally it is a hanging man and a bearish warning.
The logic: during the period, sellers managed to push price well below the open. Buyers recovered it, but the fact that sellers had that much control after a rally is the concern.
It is a warning, not a sell signal. It needs bearish confirmation on the next candle, a close below the hanging man's low or body.
Shooting Star

Appears: at the end of a rally
Signal: bearish reversal
Shape: small body at the bottom, upper wick at least twice the body, little or no lower wick
The shooting star is the bearish mirror of the hammer. At the top of a move, buyers push price sharply higher during the period, sellers overwhelm them, and the candle closes near its open. The upper wick records the failed buying.
What it means: this price attracted selling. The buyers who made the wick could not hold their gains, and the level may be resistance.
In scalping:
- Most useful at known resistance, previous highs and round numbers.
- Confirm: the next candle closes below the shooting star's body.
- Short entry below its low, stop above its high.
Inverted Hammer

Appears: at the end of a decline
Signal: possible bullish reversal
Shape: identical to the shooting star: small body at the bottom, long upper wick
As with hammer and hanging man, the inverted hammer is the context-dependent partner of the shooting star. After a decline, the long upper wick shows that buyers attempted to push higher even though they could not hold it. Demand is starting to appear at lower prices.
Weaker than the hammer, because buyers did not win the period. It needs a stronger confirmation: a bullish candle closing above the inverted hammer's high before anything is done.
Doji
The doji is the most nuanced single-candle pattern. Open and close are at nearly the same price, so the body is a line or a very thin rectangle, and the wicks can extend in either direction.

Standard Doji
Similar wicks both sides
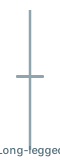
Long-legged Doji
Very long wicks both sides

Gravestone Doji
Long upper wick only

Dragonfly Doji
Long lower wick only
Standard doji. Open equals close; neither side won. At a level after a trend it can mark exhaustion. In the middle of a range it means nothing.
Long-legged doji. Price ranged widely and closed where it opened. Extreme indecision with volatility, often at turning points or before a large directional move.
Gravestone doji. Price opened, buyers pushed it sharply higher, sellers drove it all the way back to the open. Bearish after a rally at resistance: the buyers' entire effort was wiped out.
Dragonfly doji. The mirror: sellers drove price sharply lower and buyers recovered all of it. Bullish after a decline at support, and close to a hammer in meaning.
Spinning Top

Signal: indecision
Shape: small body of either colour, meaningful wicks on both sides
The spinning top is not a reversal pattern; it signals indecision. Small body, wicks both ways, neither side convincing. In context it can mark the start of exhaustion, but it needs the surrounding price action to mean anything.
The confirmation rule
Every single-candle pattern needs confirmation from the next candle. This is not optional.
A hammer followed by a red candle is not a reversal; the pattern has failed. A shooting star followed by a strong green candle is not a short; the rejection was itself rejected.
The minimum confirmation:
- Bullish patterns: the next candle closes above the top of the pattern's body.
- Bearish patterns: the next candle closes below the bottom of the pattern's body.
In scalping, the confirmation candle is also the entry trigger: wait for it to close and enter on the next open, or with a limit order just beyond the confirmation level. On a 1-minute chart the wait is sixty seconds, and it is the cheapest filter in this track.
Common mistakes
Taking the pattern in the wrong place. A hammer in the middle of a range does not matter. It matters at support: a previous low, a round number, the session VWAP.
Ignoring the wick ratio. A barely visible wick is not a hammer. Twice the body is the classical minimum.
Entering without confirmation. The hammer prints, the trader buys, the next candle continues down. This is the most common error with these patterns and the candlestick context lesson returns to it.
Seeing a doji everywhere. Not every thin-bodied candle is significant. The body has to be negligible against the wick range, and the candle has to be at an extreme.
Trading the pattern without a stop. The stop is the other side of the wick; if that gives way, the rejection has failed and the risk management lesson explains what a stop-less pattern trade does to an account.
Where to go from here
Single candles are the smallest unit of evidence. Two-candle patterns add the confirmation into the pattern itself.
- Two-candle patterns: engulfing, dark cloud cover, piercing line, harami.
Related guides:
- Candlestick basics: anatomy and the meaning of a close.
- Support and resistance: the levels where single-candle patterns count.
- Range fade: the strategy that uses the hammer and shooting star as triggers.
- Crypto scalping strategies: the full strategies track.
- Glossary: support, resistance, stop-loss.
This article is educational content, not investment advice. Trading derivatives carries substantial risk, including total loss of capital. See disclaimer.