Crypto Order Flow Trading & DOM Analysis for Scalpers
TL;DR. Order flow trading reads two streams: the order book (the DOM), which shows resting orders that may or may not ever trade, and the tape, which shows trades that did. The chart tells you where price went; the tape tells you who pushed and whether they got anywhere. For a scalper the useful signals are absorption (heavy aggressive volume with no price progress, meaning a level is being defended), aggression that moves price (a breakout with follow-through), and hidden size that keeps refilling (an iceberg). The trap is the book: large resting orders are not commitments, they can be pulled in a millisecond, and a trader who reads size as intent is the target of every spoof. Order flow confirms an entry chosen on the chart; it does not replace the chart.
Prerequisites for this lesson: Order book and DOM (how the book is built, bids, asks, depth), Stop hunts and liquidity sweeps (the sweep this lesson confirms from the tape), Open interest (what OI counts and what it cannot say). The examples reuse the range from the range lessons: support $99,400, resistance $100,000.
Two streams, one of them honest
The DOM shows what traders say they will do: resting limit orders at each price, bids below, asks above. The tape (time and sales, and the footprint charts built from it) shows what traders did: each executed trade, its price, its size, and which side was the aggressor. A trade at the ask was a market buy; a trade at the bid was a market sell. The running total of aggressive buys minus aggressive sells is the delta, and its cumulative version is the CVD.
Rubén Villahermosa Chaves, in Wyckoff 2.0, makes the distinction that keeps order flow traders out of trouble: the tape represents the past, orders that have already been executed, and so it cannot be manipulated; the book represents intentions, and intentions can be withdrawn. Everything in this lesson follows from that. Resting size is information about what might happen. Executed size is information about what did.
What the tape can show
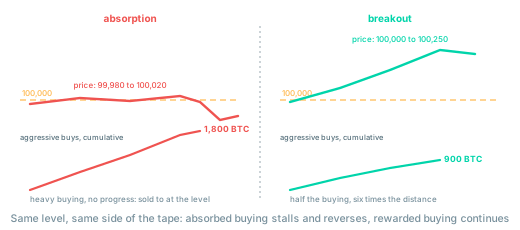
Absorption. Aggressive orders hit a level and price does not move. At resistance $100,000, over three minutes, 1,800 BTC of market buys lift the offer and price travels from $99,980 to $100,020: forty dollars for eighteen hundred coins. Somebody is selling into the buying, passively, at the level, and is not running out. The buying is being absorbed. When the aggressive buyers give up, there is nothing holding price up and it drops. The order flow books describe the signature as unusually heavy volume on both sides of the ladder around a support or resistance zone with no progress; the size that counts as "unusually heavy" is measured against the recent footprints of the same instrument, not against a fixed number.
Aggression with progress. The opposite picture: 900 BTC of market buys move price from $100,000 to $100,250 in the same three minutes. Half the volume, six times the distance. The book above the level was thin and nobody stepped in to sell; the buying is being rewarded, and the range breakout conditions are met from the tape as well as the chart.
Exhaustion. Aggressive volume shrinks on each push in the trend direction while price makes marginal new highs. The CVD flattens or turns down while price is still edging up. The trend is being carried by fewer participants each time; it is the tape's version of the climax bar from the trend lesson.
What the DOM can show, and what it cannot
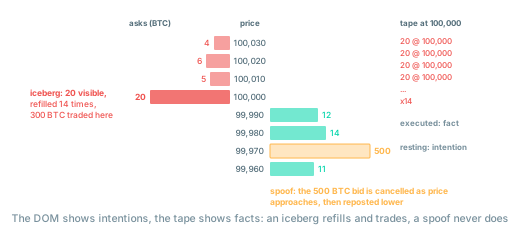
Icebergs. A visible order of 20 BTC sits at $100,000. It trades, and 20 BTC reappear. It trades again, and again there are 20 BTC. After fourteen refills, 300 BTC have traded at that one price and the visible order has never been larger than 20. Someone is selling size without showing it. Exchanges support this directly: an iceberg order shows a slice and replenishes it from a hidden remainder. The refills are visible on the tape as repeated trades at one price against a book that never depletes.
An iceberg is a reason to expect a level to hold while the refills continue, and a reason to expect a fast move when they stop, because the hidden seller was the only thing holding price down. One practitioner's order flow manual puts it plainly: an iceberg on its own will not stop a screaming market, and taking a trade because an iceberg appeared is a leap of faith. Use it as confirmation at a level the chart already chose.
Spoofs. A 500 BTC bid appears three ticks below the market. It looks like a floor. As price falls towards it, it is cancelled; price falls through the empty space; the same 500 BTC appears three ticks below the new price. It was never going to trade. Its purpose was to make sellers hesitate and buyers hurry, and it worked on everyone who treated resting size as a commitment. Spoofing is illegal on regulated futures exchanges and prosecuted; on crypto venues it happens daily and no regulator will help you. The defence is a habit: size that has not traded is a rumour. Size that is trading is a fact.
Thin books. Above resistance and below support the book is thin, as the stop hunt lesson explained. The DOM shows that directly: a few BTC per level beyond the edge against tens of BTC per level inside the range. That is not a signal to trade; it is a warning about slippage. A market order for 5 BTC into a book showing 2 BTC per level will fill three levels deep.
Open interest and the direction of aggression
The stop-hunt reversal lesson explained why a rise in open interest cannot tell you who is trapped: every new contract has a long and a short. The tape supplies the missing half. If OI rose during the spike above $100,000 and the tape shows that the aggressors were buyers (trades at the ask, delta strongly positive), then the new positions were opened by buyers taking the offer, and the passive side that sold to them was absorbing. If price then reclaims the level, the aggressive buyers are the trapped side. OI says positions were opened; delta says who opened them aggressively; the reclaim says who is wrong.
| Signal | On its own | Combined with the tape |
|---|---|---|
| OI up on the spike | New positions on both sides | With positive delta and a reclaim: trapped longs, fuel for a reversal |
| OI down on the spike | Positions closed on both sides | With positive delta: short covering, little new commitment, less fuel |
| Large resting bid | Intention, cancellable | With repeated trades against it and refills: an iceberg that is holding |
| Heavy buy delta | Aggression | With no price progress: absorption, the level is being defended |
Order flow as a confirmation layer
The strategies in this track choose the trade on the chart: a range edge, a sweep reclaim, a breakout, a pullback. Order flow answers one question about each of them: is the level doing what the chart says?
- Range fade at support. Before the long at $99,480 in the range fade lesson, the tape over the previous four 1-minute candles showed sell delta of −1,400 BTC while the lows printed $99,410, $99,395, $99,405 and $99,420. Heavy selling, no downside progress, lows rising. The support is being defended. The long is confirmed.
- Sweep reclaim. During the spike to $100,180, the aggressive buying was the largest of the hour and price made $180 of progress; on the reclaim candle, aggressive selling took over and price fell through the level with little resistance. The buying above the level was absorbed; the selling below it was not. The short is confirmed.
- Breakout. The breakout candle to $100,750 showed buy delta and price moving together; the two candles after it showed pullbacks on small sell delta that were met by buying at the old level. The level has changed sides. The retest entry is confirmed.
- Nothing. When the tape shows nothing distinctive, the chart trade is still valid. Order flow confirmation raises the size, its absence does not cancel the trade; only contradiction does. Heavy buy delta with no progress while you are planning to buy a breakout is contradiction.
Tools and what they cost
Crypto exchanges publish their trades and their books over public WebSocket feeds, which is why order flow tools for crypto are cheaper and more complete than for most markets. A footprint chart (volume by price inside each candle, split by aggressor) and a DOM with a trade tape are the two views this lesson uses. Several platforms offer both on Binance and Bybit perpetuals at retail prices, and the heatmap style of DOM, which shows resting liquidity over time as colour, makes icebergs and spoofs easier to see than a ladder does. The tools section discusses the practical choices. Whatever the tool, it is displaying the same public data with the same latency constraints the tick chart lesson described.
None of this works on a B-book venue. A CFD broker that internalises your order is showing you its own book, not a market's; the "DOM" is a display it controls, and the trades on its tape are between you and it. Order flow reading requires a transparent exchange with a public, shared book. The exchanges section explains how to tell the difference.
The traps
- Trading the book. Buying because a large bid appeared, selling because a large ask appeared. The order can vanish in a millisecond and the trader who placed it knows you are watching.
- Reading absorption without a level. Heavy volume with no progress in the middle of a range is two-sided trading, not absorption. Absorption is heavy volume with no progress at a level that matters, and the level comes from the chart.
- Confusing volume with aggression. A footprint cell with 200 BTC traded tells you nothing until you know which side was hitting. Volume is the product; delta is the direction.
- Reacting to every burst. A single 50 BTC market order is a burst; three minutes of them being absorbed is a signal. Order flow is read over a window, not on a print.
- Trusting OI alone. Both sides, always. Without the tape, a rise in OI is a fact without a direction.
- Believing the tape predicts. It confirms. Practitioners who write about the tape are consistent on this: the value of the tape is in confirming turns as they form, not in calling them in advance.
Checklist before using order flow on an entry
- Has the chart chosen the level, the direction and the stop?
- What does the delta show over the last several candles at that level: progress with the aggression, or none?
- Is any large resting order actually trading and refilling, or only resting?
- If OI moved, what does the delta say about which side was aggressive?
- Does the tape confirm, say nothing, or contradict? (Only contradiction cancels the trade.)
- Am I on a venue with a public book, and do I know my data latency?
Where to go from here
Entries are now covered from the chart, the tick sequence and the tape. The next lesson is the half of trading that most tutorials skip: how to get out, with the same rigour and the same numbers.
- Trade exit strategy: targets, trailing stops, partial exits and time stops compared on one trade.
Related guides:
- Order book and DOM: the mechanics of the book and why beyond the level it is thin.
- Stop hunts and liquidity sweeps: the sweep signature on the tape.
- Open interest: what OI counts.
- Tick chart scalping: timing the entry that the tape confirms.
- Position sizing and risk management: using confirmation to set size rather than to justify a bigger stop.
- Crypto scalping strategies: the full strategies track.
- Glossary: order flow, CVD, DOM, order book.
This article is educational content, not investment advice. Trading derivatives carries substantial risk, including total loss of capital. See disclaimer.