Crypto Trend Scalping Strategy with EMA Pullbacks
TL;DR. The trend scalping strategy joins an established trend on the pullback to a rising (or falling) moving average, with the stop below the pullback low and the first target at the previous high. It applies when the 5-minute chart shows higher highs and higher lows and the 20 EMA slopes with them; it stops applying the moment a pullback breaks the last higher low. Buying the pullback beats buying the new high on every count: smaller stop, more R, higher probability. The trap is the trend's age: the first pullback after a breakout is the best trade, and by the fourth or fifth the same setup is often the top.
Prerequisites for this lesson: Identifying trends (higher highs, higher lows, the structure that defines a trend), EMA scalping (the moving average as dynamic support), Breakout and retest (the first pullback after a breakout is a retest). Sizing: 1R = $100 on a $10,000 account; fees maker 0.02%, taker 0.05%.
When the range rules stop working
Everything in the range lessons assumed that price would come back. In a trend it does not, or not far enough to matter. The trader who keeps fading the edge of what used to be a range is now shorting higher lows into a market that makes higher highs, and each fade loses a little more than the last. Recognising the switch is the first job, and it has two parts:
- Structure. On the 5-minute chart, the last two swings made a higher high and a higher low. This is the Dow definition and it is still the cleanest one. One higher high is a breakout; a higher low that holds after it is a trend.
- The moving average. The 20-period EMA on the 5-minute chart is sloping up, price is spending most of its time above it, and each dip towards it is being bought. The EMA is not magic; it is a running average of where the last hundred minutes of trading happened, so a rising EMA means the crowd's average entry is rising, and dips to it are dips to the crowd's breakeven, where the crowd tends to defend.
When both hold, you are in a trend, and the trade is the pullback.
Why the pullback and not the new high
The instinct in a trend is to buy the breakout to a new high, because that is the moment the trend looks strongest. Al Brooks spends a good part of his books on trends arguing the opposite, and the argument is arithmetic: buying the pullback offers a smaller stop, a larger reward and a higher probability of success than buying the breakout, because the breakout buyer's stop must go below the pullback low anyway, from a worse price. The breakout buyer is also the first person to be swept: the buy stops above the old high are exactly the band the stop hunt lesson described, and a trend that is about to end tends to end with one more push through that band.
The pullback trader buys where the breakout buyer's stop is, at the moving average, after the trend has shown that it still holds there.
The entry with numbers
BTC, 5-minute chart. The trend is up: the last swing high was $101,900, the last higher low $100,900, the 20 EMA is rising through $101,200. Price pulls back from $101,900 over four candles, on falling volume, and the fifth candle touches the EMA with a low at $101,080 and closes at $101,220. That candle is the signal bar.
| Item | Value |
|---|---|
| Trigger | the signal bar touches the EMA and closes back above it |
| Entry | $101,260, a stop order one tick above the signal bar's high |
| Stop | $101,020, below the signal bar's low (risk $240, 0.24%) |
| Position for $100 risk | 0.417 BTC, notional $42,200 |
| Fees | taker entry $21 + maker exit $8 = $29 (0.29R) |
| Target 1: the previous high | $101,900: +$640, 2.7R |
| Target 2: measured leg | the previous leg ($100,900 to $101,900, $1,000) projected from the pullback low: $102,080, +$820, 3.4R |
| Remainder | trailed below each new 5-minute higher low |
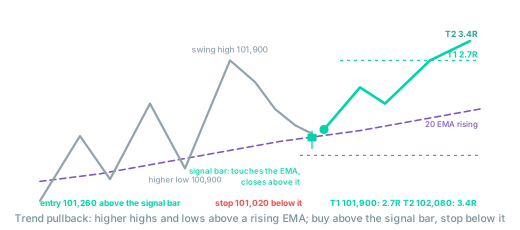
Two details in the table carry most of the edge. The entry is a stop order above the signal bar, not a limit at the EMA: the bar must first close above the average and then be taken out to the upside, which means the pullback has ended before you own anything. And the stop is below the signal bar's low, which is also below the EMA; if that gives way, the pullback was not a pullback.
The entry fee row is honest about the cost of the stop order: it executes as a taker. A limit order at the EMA is cheaper and gets a better price, but it fills on the pullbacks that keep going as well as the ones that hold. The stop-hunt reversal lesson's table of aggressive, regular and conservative entries applies here unchanged.
Reading the pullback
Not every dip to the EMA is a buy. The ones that work share a look:
- Few bars, small bodies. Two to five candles drifting down, each smaller than the impulse candles that preceded them. A pullback made of large red candles is a reversal attempt, not a pause.
- Falling volume. Sellers are not pressing; longs are taking profit and nobody is joining them.
- A close back above the EMA. The signal bar's close matters more than its low. A wick through the average that closes above it is the trend being tested and holding.
- A first pullback, or at most a second. After a breakout, the first pullback is a breakout retest and has the best record. Later pullbacks get deeper and more complex, often two-legged: a dip, a bounce that fails, a second dip. Brooks calls the entries after one-legged and two-legged pullbacks "high 1" and "high 2"; the point for a scalper is that each additional leg is the trend getting older.
Adding to a winner
The old advice "add on every pullback" is how trend traders turn a good week into a bad one, because it is applied to losing positions as well as winning ones. The rule that works:
- Add only after target 1 has been taken on the first position. The trade has paid for itself; the remainder is running at a trailed stop.
- Add on the next pullback that meets the same conditions, with its own stop below its own signal bar. It is a new trade with its own 1R, not a bigger version of the old one.
- Total open risk never exceeds 1R. Before the add, the first position's stop has been trailed to at least breakeven, so the add's $100 is the only money at risk.
- After two adds, stop. Brooks's warning applies: after a run of winning pullback entries, renewed strength without a deeper correction is more likely to be the final leg than a new one. A trader who has caught three pullbacks in a trend has done well and is now, statistically, closer to the top than to the bottom.
When the trend is over
A trend does not announce its end, but it does leave a specific mark, and the trade must stop the moment it appears.
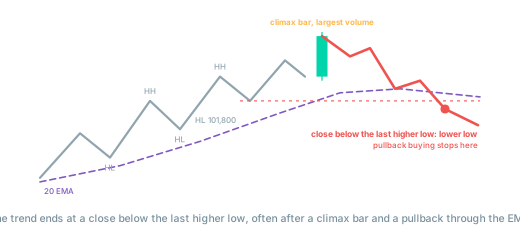
- A lower low. Price pulls back, breaks below the EMA, and closes below the last higher low. The structure that defined the trend is gone. Whether a range or a reversal follows is not yet known; what is known is that pullback buying has lost its premise. Switch to the range rules and wait.
- The climax bar. After many bars of trend, an unusually large candle in the trend direction, two or three times the size of recent candles, on the largest volume of the run. It looks like acceleration. As often as not it is the last buyers arriving at once, and the pullback that follows it is deeper than the previous ones and breaks the EMA. Do not add on the pullback after a climax bar; wait to see whether the higher low holds.
- Pullbacks that get deeper and slower. The first pullback took three bars and touched the EMA. The fourth takes ten, closes below the EMA twice, and only just holds the higher low. The trend is still technically intact and the trade is technically valid, but the size should already be half of what it was at the first pullback.
The traps
- Fading the trend because it "has gone too far". Countertrend shorts in a strong trend have the worst equation in this section: the stop sits above a high that the trend is built to exceed, and the target is a pullback that may not come. Price is never too high to go higher on the 5-minute chart. Wait for the lower low.
- Buying the EMA touch before the close. The candle touches the average and you buy the touch. Half of those candles close below it. The signal bar is a closed candle.
- Using the 1-minute chart to define the trend. A trend on the 1-minute chart lasts fifteen minutes and reverses on a single sweep. Define the trend one or two timeframes above the entry chart and enter on the lower one; the timeframes lesson has the pairings.
- Adding to the first position instead of trading a second. "Adding" that increases the risk of an open trade beyond 1R is averaging up, and when the trend ends it hands back several trades of profit in one pullback.
- Holding through the lower low. The trend ended, the structure said so, and the position stays open because the trend "will resume". Sometimes it does. The exit strategy lesson shows what waiting costs on average, and the answer is more than the occasional resumption pays.
Checklist before a pullback entry
- Does the 5-minute chart show a higher high and a higher low, with the 20 EMA rising?
- Is this the first or second pullback since the breakout, not the fifth?
- Was the pullback small-bodied and on falling volume?
- Did the signal bar touch the EMA and close above it?
- Is the entry a stop above the signal bar's high, and the stop below its low, at 1R or less?
- Is target 1 the previous high, at least 2R away?
- Where is the last higher low, and will a close below it end the trade without discussion?
Where to go from here
Every entry in this track so far has been triggered by a candle close on the 1-minute or 5-minute chart. The next two lessons refine the timing: tick charts for the second-by-second structure inside a candle, and order flow for reading what the participants are doing at the level.
- Tick chart scalping: micro-pivots and the entry timing inside a candle.
Related guides:
- Identifying trends: market structure and Dow Theory in detail.
- EMA scalping strategies: choosing the average and the timeframe.
- Breakout and retest: the first pullback after a breakout.
- Trade exit strategy: trailing stops and partial exits on a trend trade.
- Position sizing and risk management: keeping total open risk at 1R while adding.
- Crypto scalping strategies: the full strategies track.
- Glossary: trend pullback, EMA, risk/reward ratio.
This article is educational content, not investment advice. Trading derivatives carries substantial risk, including total loss of capital. See disclaimer.