Stop Hunt Trading Strategy: Liquidity Sweeps & Fakeouts
TL;DR. A stop hunt, or liquidity sweep, is a fast move through an obvious level that triggers the stop orders clustered just beyond it and then reverses. It happens because stops are market orders waiting to fire, they pile up in the same narrow band, and the order book beyond the level is thin, so a modest push produces a burst. No single villain is required: large traders looking for fills, the exchange's liquidation engine and breakout algorithms all push in the same direction. The stop hunt trading strategy is about recognition first: the candle after the pierce tells you whether you are looking at a sweep or a breakout. This lesson covers the mechanism, the tells, and where to put your own stops so that you are not the fuel.
Prerequisites for this lesson: Support and resistance (why levels are obvious to everyone), Order types (a stop order becomes a market order when it triggers), Liquidations (forced orders behave like stops). The range fade lesson supplies the range vocabulary used throughout.
Why stops cluster
Ask a hundred traders where they put the stop on a short taken at resistance and most will say "just above the high". Ask where they put the buy stop for a breakout trade and they will say "just above the high" too. The previous high, the range edge, the round number: the same handful of prices are visible to everyone with a chart, and the same handful of rules for placing stops around them are taught in every tutorial. The result is not a spread of orders across the chart but a dense band of them a few ticks to a few tenths of a percent beyond each obvious level.
On BTC with resistance at $100,000, that band might run from $100,050 to $100,200. It contains three kinds of orders that all do the same thing when touched:
- Stop-losses of shorts taken at or below the level. A triggered stop on a short is a market buy.
- Buy stops of breakout traders waiting for the level to give way. Also market buys.
- Liquidation prices of leveraged shorts. When the mark price reaches them, the exchange closes the position with a market buy. The liquidations lesson describes the engine; for this purpose it is a stop that the trader did not place and cannot cancel.
Larry Harris, in Trading and Exchanges, describes the general problem: stop orders demand liquidity at exactly the moment liquidity is scarce, and by doing so they accelerate the move that triggered them. That is the whole mechanism of a sweep in one sentence.
Why the book is thin beyond the level
Resting limit orders sit where traders want to trade: bids inside the range near support, asks inside the range near resistance. Beyond resistance there are few resting sellers, because a seller who wanted to sell at $100,150 would have sold at $100,000 already. So the order book above the level is thin at exactly the price where the stop band is dense.
Put those two facts together. A push of modest size through $100,000, say 60 BTC of market buying, meets little resistance and lifts price into the band. The first stops trigger and add their own market buys. Those lift price further into the band, which triggers more stops. For a few seconds the buying is self-feeding, and the 1-minute candle prints the largest volume of the hour on the way to $100,180.
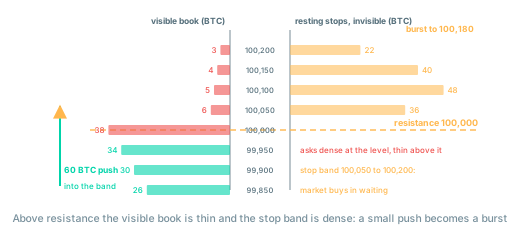
Then the buying stops, because it was never buying in the ordinary sense. Nobody in the band wanted to own BTC at $100,150; they were closing shorts or being closed. Once the band is emptied, there is no bid underneath the new price. If no genuine buyers arrive to take the other side, price falls back through the level as fast as it rose, and the traders who bought the breakout are now long above a level that is closing back under them.
Who does the pushing
The word "hunt" suggests an intention, and this is where most explanations go wrong. There is no need for a manipulator, and treating the market as a villain with a plan leads traders to fight it instead of reading it. Three kinds of participants push into the band, for their own reasons, and the chart cannot tell them apart:
- Large traders who need liquidity. A fund that wants to sell 500 BTC cannot do it at $99,900 without pushing price down against itself. The stop band above $100,000 is the largest pool of buy orders on the chart. Pushing price into it, then selling into the burst, fills the order at better prices than the visible book offers. This is the version that traders call a hunt, and it is real, but it is one of three.
- The liquidation engine. Leveraged shorts with liquidation prices in the band get closed by the exchange as price rises. The engine does not care about levels; it cares about margin. Its buying is mechanical and stops the instant the last position in the band is closed.
- Breakout traders and momentum algorithms. Anyone with a rule that says "buy when price exceeds the high" buys on the way up. Their buying is genuine but conditional: if price does not continue, they exit, and their exits are the first wave of selling on the way down.
The sweep looks the same whichever of the three dominated. What matters for the trade is not who pushed but what happened afterwards.
Sweep or breakout: the candle after the pierce
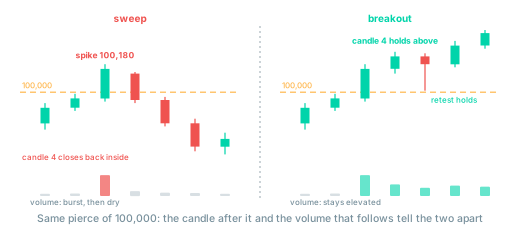
Every breakout starts as a pierce of a level, and every sweep does too. For the first thirty seconds they are identical. Al Brooks makes the point in his books on price action that most breakout attempts from a trading range fail and that the failure is usually visible within a bar or two; the question is what to watch during those bars.
| Tell | Sweep | Breakout |
|---|---|---|
| The next candle | Closes back inside the level | Holds beyond it, often closing near its high |
| Volume | A burst on the pierce, then it dries up | Elevated on the pierce and stays elevated |
| Price against volume | Heavy buying, little progress: price barely advances despite the volume | Buying and progress together: each burst lifts price further |
| Acceptance | None; the level is recrossed within one or two candles | Two or three candles hold above the level; a pullback to it finds buyers |
| What follows | A move back through the range, often to the opposite edge | A retest from above, then continuation |
The order flow tools in lesson 15 sharpen this: on a sweep, the aggressive buy volume climbs while price stalls, because passive sellers above the level are absorbing the forced buying; on a breakout, price moves with the aggression. Open interest adds one more clue with a caveat that the reversal lesson explains: rising OI on the spike means new positions were opened on both sides, and if the spike then reverses, the new longs are trapped above the level and their exits become the reversal's fuel.
The two ways to use this
As a filter. The obvious use. When price pierces a level and the next candle closes back inside, do not buy the breakout. The traders who bought it are about to sell, and you do not want to join them. The range fade lesson's entry, a rejection candle that closes back inside, is a sweep trade in all but name.
As a setup. When the pierce fails and price reclaims the level, the reversal has fuel: trapped breakout longs exiting, shorts re-entering, and the stops on the other side of the range waiting to be swept in turn. The next lesson, stop-hunt reversal, turns that into a trade with an entry, a stop, targets and numbers. This lesson stops at recognition on purpose: the trade is easy to describe and hard to execute without first being able to tell the two cases apart.
Where to put your own stops
If stops cluster and clusters get swept, the question is how to avoid being part of the cluster.
- Beyond the sweep zone, not beyond the level. A stop $20 above the high is in the band. A stop 1 to 2 ATR above the high, beyond where a typical sweep reaches, is outside it. The price of this is a smaller position for the same R; the benefit is that a sweep that reverses does not take you out of a correct trade.
- Accept the tight stop and plan the re-entry. Some scalpers prefer the tight stop, accept that sweeps will hit it, and re-enter on the reclaim. This works if the re-entry is a rule written before the trade, not a reaction to being stopped. The playbook lesson covers how to write such rules.
- Do not hide the stop by removing it. The alternative that beginners choose, a mental stop or no stop, turns a sweep into a liquidation. The band above resistance contains liquidation prices for a reason: those traders also thought the level would hold.
- Trade where the book is real. On a transparent exchange the sweep is a market event that anyone can read. On a B-book broker or a CFD "kitchen", the counterparty to your trade is the broker, it can see your stop, and it can widen its own spread into it. The exchanges section covers how to tell the two apart. Order flow reading is only possible on the first kind.
The traps
- Calling every wick a hunt. A wick beyond a level is common; a sweep is a wick beyond a level followed by a reclaim and a move the other way. Without the reclaim it is just a wick, and half of them become breakouts.
- Shorting the spike. The spike is the moment of maximum forced buying. Shorting into it puts you against the burst with no stop reference above you, because the top of the spike is not known until it is over. Wait for the close back inside.
- Assuming intent. "The market maker is hunting my stop" is a story, not an analysis. The mechanism is mechanical and it explains the chart without anyone needing to know where your stop is.
- Reading OI on its own. A jump in open interest on the spike says new positions were opened, not who opened them. A long and a short were created for every contract. The direction comes from the reclaim, not from the OI.
Checklist: is this a sweep?
- Was the level obvious: a previous high or low, a range edge, a round number?
- Did the pierce come on a volume burst that was the largest of the hour?
- Did the next candle close back inside the level?
- Did volume dry up after the reclaim rather than stay elevated?
- Did price fail to make progress despite the buying (or selling) on the pierce?
- Where is my stop relative to the band, and did I decide that before the trade?
Where to go from here
You can now recognise a sweep while it is happening and keep your own orders out of the band. The next lesson trades it.
- Stop-hunt reversal: entry on the reclaim, stop above the sweep, targets across the range, with numbers.
Related guides:
- Range fade: the entry that a sweep at the range edge produces.
- Liquidations: the forced orders that make sweeps larger in crypto than in other markets.
- Order book and DOM: why the book beyond a level is thin.
- Range breakout: the other outcome of a pierce and how to trade it.
- Position sizing and risk management: sizing for a stop placed beyond the sweep zone.
- Crypto scalping strategies: the full strategies track.
- Glossary: liquidity sweep, stop hunt, stop-loss, liquidation.
This article is educational content, not investment advice. Trading derivatives carries substantial risk, including total loss of capital. See disclaimer.