Crypto Trade Exit Strategy: Distribution, Order Flow & OI
TL;DR. A trade exit strategy is a rule, written before the entry, that says when the trade is over: at a target, at a trailing stop, at a broken structure, after a time limit, or in pieces. Each rule captures a different part of the move and gives up a different part, and none of them is best on every trade; the one that works is the one that matches the premise of the entry and is applied the same way every time. Open interest and the tape add a genuine signal for trend exits: when price makes new highs while positions are being closed and aggression fades, the move is running out of fuel. The trap is the breakeven stop that feels free and the exit that is decided while the trade is open.
Prerequisites for this lesson: Trend scalping (the trade used in every example below), Open interest (what a falling OI on rising price means), Order flow and DOM (aggression and exhaustion on the tape). Sizing follows position sizing and risk management: 1R = $100, and the trade below risks $240 per BTC.
Why the exit is a rule and not a decision
Every entry in this track was defined by conditions that could be checked before the order went in. Most traders then handle the exit by feel: hold a little longer because it is working, take profit early because it might reverse, move the stop because the loss looks large. The old rule about stops applies to every exit: place them at the time of the original trade, because that is the last moment you are objective. Once the position is open you are not analysing the market; you are analysing your own P&L, and the P&L is a bad analyst.
So an exit is a rule. This lesson compares the rules on one trade and shows what each costs and pays, then adds the two market signals that can end a trend trade before the structure does.
One trade, five exits
The trade is the pullback long from the trend lesson: entry $101,260, initial stop $101,020, risk $240 per BTC. After the entry, the 5-minute candles close at:
| Bar | 1 | 2 | 3 | 4 | 5 | 6 | 7 | 8 | 9 | 10 |
|---|---|---|---|---|---|---|---|---|---|---|
| Close | 101,400 | 101,650 | 101,880 | 101,700 | 101,950 | 102,300 | 102,100 | 101,800 | 101,500 | 101,350 |
The trend continues to $102,300, then rolls over. Here is where each rule takes you out.
| Exit rule | Where it triggers | Exit price | Result |
|---|---|---|---|
| Fixed target at the previous high | bar 5 trades through $101,900 | $101,900 | +$640, 2.7R |
| Trailing stop 1R ($240) below the highest close | highest close $102,300 at bar 6; bar 8 trades through $102,060 | $102,060 | +$800, 3.3R |
| Trailing stop 2R ($480) below the highest close | bar 8 trades through $101,820 | $101,820 | +$560, 2.3R |
| Half at 1R, half trailed 2R | half at $101,500 on bar 2; half at $101,820 on bar 8 | blended | 0.5 × 1.0R + 0.5 × 2.3R = 1.7R |
| Structure: close below the last higher low ($101,700, bar 4) | bar 9 closes at $101,500 | $101,500 | +$240, 1.0R |
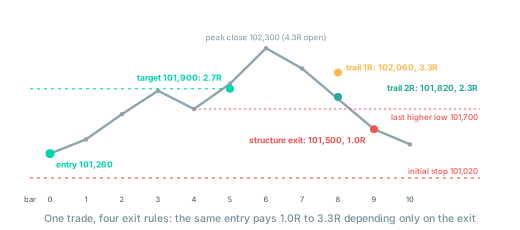
The same entry, the same stop, the same market, and the result ranges from 1.0R to 3.3R. On this path the tight trailing stop wins. On a path where price pulls back $250 after bar 3 and then runs to $103,000, the tight trail exits at bar 4 for 1.6R and the wide trail rides most of the way to $103,000 for more than 5R. On a path where the trend fails at bar 3, the fixed target never fills and the structure exit takes a small profit while the others give it all back to the trail. There is no rule that wins every path, which is why the choice is not made per trade.
What each rule is for
Fixed target. Highest win rate, capped reward. The right rule when the target is structural: the far edge of a range, the measured move of a breakout, a level where the trade's premise ends. The range fade lesson uses it because a range trade has nowhere to go beyond the other edge. It is the wrong rule for a trend trade, where the premise is that price will go further than the last swing.
Trailing stop. Robert Pardo's definition in The Evaluation and Optimization of Trading Strategies is the practical one: the trailing stop is the price which, if penetrated, tells you the move you were riding is over. Its distance sets the trade-off. A tight trail keeps more of a move that reverses sharply and is stopped by noise on a move that pauses. A wide trail survives the pauses and gives back more at the end. Trail behind something the market drew, the last 5-minute swing low or a multiple of ATR, rather than behind a round number of dollars, and never move it backwards.
Partial exits. Half at a fixed target, the rest trailed. The blend lowers the variance of results: fewer trades that go from +2R to 0, fewer trades that reach +6R. It is the easiest rule to follow under pressure and the wide range lesson built its target ladder on it. Its cost is the average win: on the path above it earned 1.7R where the pure trail earned 2.3R.
Structure exit. For trend trades, the premise is the sequence of higher lows; a close below the last one ends the premise, and the trade with it. It exits late by construction, because it waits for proof that the trend has ended rather than a sign that it might. It gives back a lot on a sharp reversal (1.0R above, from a peak of 4.3R) and it is the rule most likely to hold a trade through a shallow pullback into a second leg. Use it as the outer boundary, with a trail inside it.
Time stop. If the trade has not reached a set profit within a set number of candles, exit flat. A version used by systematic traders: if the trade is not in profit by halfway through the expected duration of the move, get out. For a scalp with an expected duration of ten to fifteen candles, "no progress after five" is a reasonable version. Time stops cost nothing on trades that work and save fees and attention on the ones that are going nowhere; the stop-hunt reversal lesson used one for exactly that reason.
The breakeven stop
Moving the stop to the entry price as soon as the trade shows a profit is the most popular exit rule among beginners and the most expensive. It feels like removing risk. What it does is place the stop at the one price the market is most likely to revisit: the level you entered at, which is by construction a level where the last pullback ended, so the next pullback ends near it too.
Kevin Davey, who tests these things systematically in Building Winning Algorithmic Trading Systems, reports that breakeven stops limit profit potential in almost every system he has examined, because they exit on a retracement after which the market resumes its trend. On the trade above, a breakeven stop set after bar 2 survives, but move the path's bar 4 close from $101,700 to $101,250 and the same trade exits at $101,260 for zero, one bar before the run to $102,300. The traders who "never let a winner turn into a loser" have replaced a small number of losers with a large number of zeros, and the zeros were their best trades.
If the initial stop must move, move it to a level with a reason: above the sweep high after a reversal reaches target 1, below the new higher low after a trend makes one. Never to the entry because it is the entry.
The signals that end a trend trade early
Two market signals can tell you that a trend is running out before the structure breaks, and both come from the order flow and open interest lessons.
Open interest falling on new highs. Through the healthy part of an uptrend, OI rises with price: new longs are entering and new shorts are being created to sell to them. The classic futures image for this is fuel: the positions on the wrong side are what pays the positions on the right side, and rising OI means the fuel is being replenished. When price makes a new high and OI falls, positions are being closed into strength. Longs are taking profit and the shorts who cover are the only buyers. The trend can continue for a while on that buying, but its fuel is leaving, and a trailing stop should be tightened.
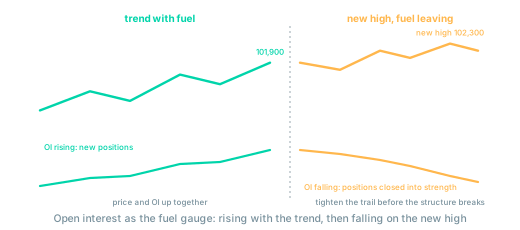
The old telling of this idea had a whale who accumulated in the range, drove the trend, and distributed at the top while retail bought the highs. Strip out the character and the mechanism is the same and better: OI rising during a consolidation means positions are being built; OI rising with the trend means the trend is being financed; OI falling on new highs means it is being cashed out. Nobody needs to know who the participants were. The fuel gauge reads the same either way.
Aggression fading on the tape. Each push to a new high comes on less aggressive buy volume than the last; the CVD flattens while price edges up; the last push is a large candle on the largest volume of the run, the climax bar from the trend lesson. The tape says the buyers are fewer and the last of them arrived together. Combined with falling OI, this is the signal to take the remaining position off at market rather than wait for the trail.
Neither signal is a reason to short. They are reasons to stop being long. The reversal, if it comes, is a separate trade with its own entry.
Matching the exit to the entry
Davey's practical point is that the exit rule has to coordinate with the entry rule, or the exit will fire on the noise that the entry was designed to tolerate. The pairings that follow from this track:
| Entry | Premise | Primary exit | Outer boundary |
|---|---|---|---|
| Range fade | price returns to the middle and the far edge | fixed targets, half at the midline | a close outside the range |
| Stop-hunt reversal | trapped traders sell to the middle of the range | half at target 1, stop moved above the level | time stop after ten candles without progress |
| Momentum breakout | expansion to the measured move | fixed target, remainder trailed | a close back inside the range |
| Trend pullback | higher lows continue | trail behind swing lows, tightened on falling OI | a close below the last higher low |
The pairing is written into the playbook with the entry, and the playbook's records are what eventually tell you whether your trail is too tight or your targets too near. Fifty trades of one rule teach more than five hundred trades of improvisation.
Checklist before the entry, about the exit
- Which exit rule, and is it written down before the order?
- What is the target, and is it a level the market drew?
- What is the trail, and what does it trail behind?
- What ends the premise of the trade (a close where)?
- After how many candles without progress is the trade flat?
- If the stop moves, to what level, and why that level?
- Will I read OI and the tape on new highs, and what will I do if they fade?
Where to go from here
Entries, confirmation and exits are now each a set of rules. The last lesson of the track puts them into the document that makes them a system.
- How to build a scalping playbook: one setup, one card, the statistics that tell you whether it works.
Related guides:
- Trend scalping: the trade every exit above was applied to.
- Open interest: the fuel gauge in detail.
- Order flow and DOM: reading exhaustion on the tape.
- ATR: a volatility-based trailing distance.
- Position sizing and risk management: why exits are measured in R.
- Crypto scalping strategies: the full strategies track.
- Glossary: take-profit, stop-loss, open interest, expectancy.
This article is educational content, not investment advice. Trading derivatives carries substantial risk, including total loss of capital. See disclaimer.