Tick Chart Trading for Scalping: How to Read Micro-Impulses
TL;DR. A tick chart closes a bar after a fixed number of trades instead of a fixed number of seconds, so it slows down when the market is quiet and speeds up when it is busy. For a scalper, tick chart trading is a timing tool: the 5-minute chart chooses the level and the direction, and the tick chart shows the sequence of micro-pivots inside the candle so that the entry is taken as the pullback ends rather than when the candle closes. The trap is to let the tick chart set the stop as well. A stop at a micro-pivot is so tight that fees become half the risk; the stop stays at the structural level, and the tick chart only improves the price.
Prerequisites for this lesson: Best timeframes for scalping (the timeframe pairing this lesson refines), Trend scalping (the pullback entry that the micro-pivot entry is a miniature of), Trade execution (latency and the cost of taker fills). Sizing: 1R = $100 on a $10,000 account.
What a tick chart is
A 1-minute candle closes every sixty seconds whether three trades happened or three thousand. A 200-tick bar closes after two hundred trades whether that took two seconds or four minutes. The clock is the market's activity, not the wall.
Two consequences follow. In a quiet hour, a tick chart prints a handful of bars where the 1-minute chart printed sixty, so it stops inventing structure out of a market that is doing nothing. In a fast minute, a tick chart prints ten or twenty bars where the 1-minute chart printed one, so the swings inside that minute become visible instead of being buried in a single candle with a long body.
There is a statistical reason this matters beyond convenience. Mandelbrot and Taylor observed in the 1960s, and later work has confirmed, that price changes measured over a fixed number of transactions are better behaved than price changes measured over fixed time: closer to normal, with less of the fat-tailed clustering that time bars show. Marcos López de Prado's Advances in Financial Machine Learning summarises the evidence and adds the practical caveat: tick counts are inflated by order fragmentation (one market order that fills against ten resting orders prints as ten trades), which is why volume bars, which close after a fixed amount of BTC has traded, are often the better tool. On crypto perpetuals both types are available on the major charting platforms, and everything below applies to either.
Same minute, two charts
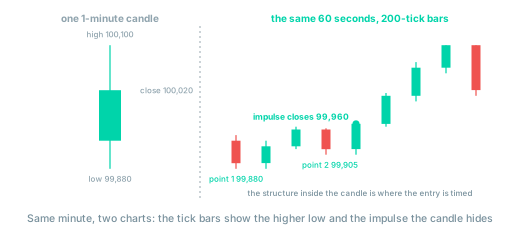
The left panel is what a 1-minute trader sees at the end of the minute: a candle with a low at $99,880 and a close near $100,020, a hammer of sorts, and an entry on the next candle's open. The right panel is what a tick trader saw during the minute: a low at $99,880, a bounce, a higher low at $99,905, and an impulse bar that closed at $99,960 while the 1-minute candle was still open. Both traders take the same trade. One of them is in $58 lower, and the section on numbers shows what that does to the R.
Micro-pivots and the sequence
Price on a tick chart moves in small waves. A push up, a pause, a pullback: the pause is a local high, a micro-pivot. A dip, a pause, a bounce: a local low. The rule for reading them is the trend rule from the trend lesson with the timeframe removed:
- A micro-uptrend is alive while each pullback low is higher than the previous one.
- A micro-downtrend is alive while each bounce high is lower than the previous one.
- The moment a pivot is broken in the other direction, that micro-trend is over.
None of this is a strategy by itself. A micro-uptrend on a tick chart lasts a minute or two and reverses on a single burst of market orders. What the sequence gives you is timing at a level that the 5-minute chart has already chosen.
The entry sequence
The 5-minute chart says: uptrend, pullback to support at $99,900, buy the hold. The tick chart says when.
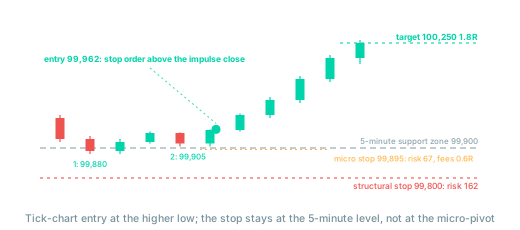
- Point 1. Price drops into the support zone and makes a low: $99,880. The first pivot low. You do nothing; a single low proves nothing.
- Point 2. Price bounces to $99,950 and pulls back, and the pullback stops above point 1: $99,905. A higher low. The sellers who made point 1 could not make a lower one. This is the pattern; it is not yet the trade.
- The impulse. From point 2, a tick bar prints a full body upward and closes above the bounce high at $99,950: it closes at $99,960. Buyers have stepped in on the higher low. The entry is a stop order at $99,962, one tick above that close.
- Resolution. Within the next two or three tick bars, price should extend above the impulse bar's high. If instead the next bar closes back below $99,950, the impulse failed; the trade is scratched at market for a loss of a few dollars per BTC, and you wait for a new point 1.
The scratch rule is what separates tick-chart timing from guessing. The impulse either continues at once or it was noise; the tick chart shows you which within seconds, and a trade that has not resolved is closed before it becomes a real loss.
The numbers, and where the stop goes
Same trade, three ways to define it. The target in all three is the next 5-minute resistance at $100,250.
| 5-minute close entry | Tick entry, structural stop | Tick entry, micro stop | |
|---|---|---|---|
| Entry | $100,020 | $99,962 | $99,962 |
| Stop | $99,800 (below the 5-minute support) | $99,800 | $99,895 (below point 2) |
| Risk per BTC | $220 | $162 | $67 |
| Position for $100 risk | 0.455 BTC | 0.617 BTC | 1.493 BTC |
| Notional | $45,500 | $61,700 | $149,200 |
| Maker fees, round trip (in R) | $18 (0.18R) | $25 (0.25R) | $60 (0.60R) |
| Taker fees, round trip (in R) | $46 (0.46R) | $62 (0.62R) | $149 (1.49R) |
| Reward to $100,250 | +$230, 1.0R | +$288, 1.8R | +$288, 4.3R |
The middle column is the lesson. The tick chart improved the entry by $58, which turned a 1.0R trade into a 1.8R trade with the same stop and the same target. That is what the tool is for.
The right column is the trap. The same entry with the stop at the micro-pivot shows 4.3R, and beginners see that number and nothing else. But a $67 stop means a 1.49 BTC position, and the exchange charges fees on 1.49 BTC: 0.6R per trade with limit orders, 1.5R with market orders. With taker fills, a trade that reaches its target makes 4.3R and pays 1.5R; a trade that scratches pays 1.5R and makes nothing; a trade that is stopped loses 2.5R. The narrow range lesson's fee test applies with a vengeance: the tighter the stop, the larger the position, the larger the fee bill in R. A micro-pivot stop also sits inside the noise of the level, so it is hit by ordinary fluctuation on trades that would have worked.
The rule: the tick chart chooses the entry, the 5-minute chart chooses the stop.
Setting up the chart
- Bar size. Choose the tick count so that, in normal activity, the chart prints roughly one bar every five to fifteen seconds on BTC. On Binance or Bybit BTC perpetuals that is somewhere between 100 and 500 ticks depending on the hour, and it needs adjusting as activity changes. A chart that prints a bar per second is noise; one that prints a bar per minute has lost the point.
- Volume bars as the alternative. A bar per 25 to 50 BTC traded avoids the fragmentation problem. Either type works; pick one and keep it, because pivots are only comparable on a fixed bar definition.
- Venue matters. Tick counts are venue-specific. A 200-tick bar on Bybit and on Binance cover different amounts of trading, and neither can be reconstructed from another venue's data. Adam Grimes points out in The Art and Science of Technical Analysis that range bars built after the fact differ from those built live; the same caveat applies to any activity-based bar, which is why tick-chart setups are tested forward in a playbook, not backtested from downloaded history.
- Latency. A tick chart displays trades as they arrive at your screen. On a retail connection that is 100 to 500 milliseconds after they happened at the exchange, sometimes more during a burst. The impulse bar you see closing has already closed. Enter on the close you can see, with a stop order, and accept that the fill is a tick or two worse; chasing an impulse that is already three bars old is how tick traders end up buying the top of the bounce. The API vs interface lesson covers what can and cannot be done about latency.
The traps
- Trading the tick chart without the 5-minute chart. Micro-pivots form everywhere, all the time. Without a level from the higher timeframe, every point 2 is a trade, and a hundred trades a day at 0.25R of fees each is a losing strategy regardless of the entries.
- Buying the impulse late. The impulse bar closes at $99,960; by the time the order is placed price is $100,010. The entry has moved 30% of the way to the target and the R has collapsed. If the impulse is gone, so is the trade.
- Letting the scratch become a loss. The next bar closes below the bounce high and the trade stays open because the stop is "far away anyway". The scratch rule exists because the tick chart told you the entry was wrong; the structural stop is there for the trades where the entry was right and the level failed.
- Widening the tick count to "smooth" the chart. A larger bar count hides the pivots you were trying to see. If the chart looks like noise, the market is in a narrow range and the answer is to wait, not to change the bar size until a pattern appears.
- Believing the resolution rule is a strategy. Entry plus resolution is a timing technique. It does not create edge; it reduces the cost of expressing an edge the 5-minute chart already supplied.
Checklist before a tick-chart entry
- Has the 5-minute chart supplied the level, the direction and the stop?
- Did point 2 form above point 1 (for a long)?
- Did the impulse bar close above the bounce high, and is the entry a stop order just above it?
- Is the stop at the structural level, not at point 2?
- What is the fee bill in R at this position size?
- If the next bar closes back below the bounce high, will I scratch at market?
- Is my chart's latency known, and am I entering on a close I can see rather than one I remember?
Where to go from here
The tick chart shows the sequence of prices. The next lesson shows what produced them: the resting orders that absorbed the selling at point 1, the aggression that made the impulse, and how to tell a level that is being defended from one that is being run.
- Order flow and DOM: absorption, aggression, icebergs and the confirmation that a level is holding.
Related guides:
- Best timeframes for scalping: pairing the entry chart with the structure chart.
- Trend scalping: the pullback entry the micro-pivot sequence mirrors.
- Trade execution: stop orders, limit orders and what each costs.
- API vs exchange interface: latency and what a retail setup can realistically see.
- Position sizing and risk management: why a tight stop means a large position and a large fee bill.
- Crypto scalping strategies: the full strategies track.
- Glossary: timeframe, latency, maker, taker.
This article is educational content, not investment advice. Trading derivatives carries substantial risk, including total loss of capital. See disclaimer.