ATR Indicator Explained: Stop-Loss & Volatility for Scalping
TL;DR. The ATR indicator, average true range, measures how far price typically travels in one candle on the chart you are trading. It says nothing about direction and everything about noise, which is why it is the tool for placing a stop outside the noise and sizing the position from that stop. A stop of 1.5 to 2 ATR beyond the level survives the ordinary probe that a fixed-percentage stop does not, and the position size follows from the same number. The limitation is that ATR looks backwards: it is smallest exactly when a compression is about to end, and it does not know that a news candle five times its size is thirty seconds away.
Prerequisites for this lesson: Position sizing and risk management (the formula that turns a stop distance into a position), Support and resistance (the structural level the ATR stop sits beyond), EMA scalping (the previous lesson in this section). Lesson 3 of the indicators section.
What ATR measures
J. Welles Wilder introduced the true range in 1978 for commodity markets that gapped between sessions. For one candle it is the largest of three distances: the candle's high minus its low, the high minus the previous close, and the low minus the previous close. The last two catch a gap that the first would miss. The average true range is the average of that number over a lookback, fourteen candles by default, with Wilder's own smoothing that gives older candles a slowly decaying weight.
Crypto trades around the clock, so gaps are rare and the true range is usually just the candle's range; the gap terms still matter across a thin weekend hour or an exchange outage. The point of the number is not the formula. It is that ATR is an estimate, in dollars, of how far price moves in a candle when nothing in particular is happening, which is the definition of noise.
On BTC at $100,000 in an ordinary session, as an order of magnitude: the 1-minute ATR(14) sits around $60 to $150 (0.06% to 0.15%), the 5-minute around $150 to $400, and the 1-hour around $600 to $1,200. The proportions matter more than the figures, which change with the regime: the 5-minute candle contains roughly two and a half times the noise of the 1-minute candle, not five times, because moves partly cancel within the longer candle.
The stop outside the noise
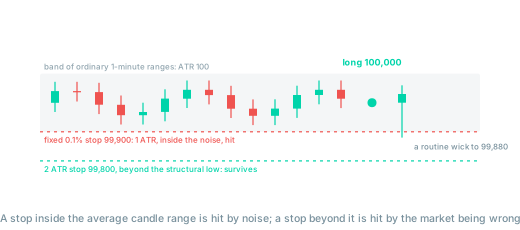
The mistake this lesson exists to prevent: a fixed stop, "I always risk 0.1%", placed without looking at the candle sizes. On a 1-minute BTC chart with an ATR of $100, a $100 stop is one ATR, the distance an ordinary candle travels with no information in it. The trade is stopped by noise whether the read was right or not, and the trader concludes that the market hunts stops. It does not need to; the stop was inside the range of a normal minute.
The rule that follows: the stop goes beyond the structural level, as the support and resistance lesson describes, and at least 1.5 to 2 ATR from the entry on the entry chart, whichever is further. The structure gives the reason; the ATR gives the room.
A worked trade
5-minute BTC chart, ATR(14) = $250. Price pulls back to a level at $100,000 that held twice earlier in the session and prints a rejection candle whose wick reaches $99,760.
| Item | Value |
|---|---|
| Entry | $100,000 on the close of the rejection candle |
| Structural stop | below the wick: $99,700 |
| Check against noise | $300 ÷ $250 = 1.2 ATR, just beyond the ordinary candle; widen to 1.5 ATR: $99,625 |
| Risk per BTC | $375 |
| Position for $100 of risk | 0.267 BTC, notional $26,700 |
| Maker fees, round trip | $11 (0.11R) |
| Target, at least 2R | $100,750: 3 ATR above the entry on the 5-minute chart, reachable in a few candles of a trend, not in a range |
| A fixed 0.1% stop instead | $99,900: 0.4 ATR, inside the noise; stopped by the next ordinary candle |
Three things follow. The ATR check widened a structural stop that was slightly too tight, and the position shrank to keep the risk at $100. The target was sanity-checked in ATR units: a target of 3 ATR is realistic in a trend and unrealistic in a range, and the range fade lesson's targets are at the midline for that reason. And the fee bill in R is a function of the stop: the wider stop made the position smaller and the fees a smaller share of the risk, which is the fee test working in your favour.
ATR by hour: the same stop is wrong twice a day
Volatility on BTC has a daily shape. The Asian hours are quiet; the European open lifts the ranges; the overlap with the US session from about 13:00 to 17:00 UTC is where the 1-minute ATR is highest, and it fades into the US afternoon. A stop sized on the 04:00 UTC ATR is inside the noise at 14:30, and a stop sized at 14:30 is needlessly wide at 04:00, which means a needlessly small position.
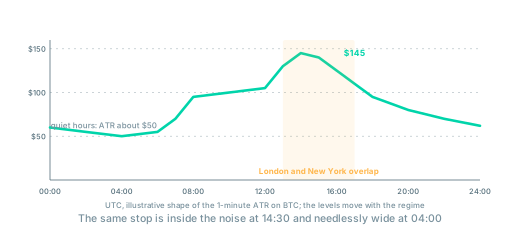
The shape is the point; the levels move with the regime. Read the ATR of the hour you are trading, not the one you read yesterday, and expect scheduled releases to sit outside the profile entirely.
Regime: when ATR is small and when it is rising
Practitioners who use ATR to classify regimes describe the cycle plainly: after range contraction comes range expansion, and after expansion, contraction. A 1-minute ATR at its lowest of the day is the narrow range of the strategies track, the compression that tends to precede a move. Two consequences for stops:
- Small ATR is the moment stops are tightest and the market is about to leave. A stop sized at the bottom of a compression is correct for the compression and wrong for the expansion. The range breakout lesson's stop sits back inside the range for exactly this reason: it is placed by structure, and structure does not shrink with the ATR.
- Rising ATR means the same dollar risk buys a smaller position. When the ATR doubles after a headline, the stop doubles and the position halves, automatically, which is the sizing formula doing its job. Traders who keep the same position through a volatility jump have doubled their risk without deciding to.
The Bollinger Bands lesson measures the same cycle with the standard deviation of closes rather than the range of candles; the two agree on the regime and differ in detail.
Other uses
- Trailing stops. A trail of 2 to 3 ATR below the highest close is a volatility-scaled version of the trailing rules in the exit strategy lesson; it widens in fast markets and tightens in quiet ones without a decision.
- Comparing instruments. ATR as a percentage of price puts BTC, ETH and a mid-cap coin on one scale. A coin with a 1-minute ATR of 0.4% needs a stop four times as wide as BTC and a position a quarter of the size for the same risk, which is why the capital lesson points small accounts at instruments with small minimums rather than at volatile ones.
- A filter for the setup. A range whose height is under 3 ATR is not worth fading after fees; a breakout candle under 1.5 ATR is not a breakout; a pullback deeper than 2 ATR is not a pullback. The strategies track states these thresholds in dollars; ATR is how you carry them from one day to the next.
The traps
- ATR as a direction signal. It has none. Rising ATR means larger candles, in either direction.
- The fixed multiple. 2 ATR is a starting point, not a law. The structural level decides where the stop goes; the ATR decides whether it has room. When the two disagree, widen to the structure and shrink the position, or skip the trade.
- Sizing on a stale ATR. The 14-candle average lags a volatility jump by several candles. In the first minutes after a release, the ATR still describes the calm before it. Wait for it to catch up, or size by the current candle ranges by eye.
- Tight timeframe, tight stop, large fees. A 1-minute ATR stop is small in dollars, which makes the position large and the fees a large share of the risk, as the tick chart lesson shows in numbers. The stop is set on the chart that carries the structure, usually the 5-minute chart, not on the chart that times the entry.
- Believing the stop is safe because it is outside the ATR. It is outside the ordinary noise. A cascade or a headline is not ordinary, and the liquidations lesson describes candles that are many ATR long.
Checklist
- What is the ATR on the entry chart, at this hour?
- Is the stop beyond the structural level and at least 1.5 to 2 ATR from the entry?
- Position = risk ÷ stop distance; what are the fees in R at that size?
- Is the target realistic in ATR units for this regime (a range or a trend)?
- Has the ATR risen since the trade was planned? Then the size is too large.
Where to go from here
ATR measures the size of the noise. The next lesson measures the same thing with the standard deviation of closes, and turns the compression it detects into a setup.
- Bollinger Bands: the squeeze, the breakout confirmation, and why the bands are not support and resistance in a trend.
Related guides:
- Position sizing and risk management: the formula that the ATR stop feeds.
- Support and resistance: the structural level the stop sits beyond.
- Narrow range scalping: what a compressed ATR looks like as a setup.
- Trade exit strategy: ATR-scaled trailing stops.
- Best indicators for scalping: the section hub.
- Glossary: ATR, stop-loss, position sizing.
This article is educational content, not investment advice. Trading derivatives carries substantial risk, including total loss of capital. See disclaimer.