VWAP Trading Strategy for Crypto Scalping
TL;DR. VWAP, the volume-weighted average price, is the average price at which the session has traded so far, weighted by how much traded at each price: the cost basis of the average participant today. Price above VWAP means the day's buyers are in profit and the session leans long; below, the reverse. A VWAP trading strategy for scalping uses it as the session's bias filter, as a level where pullbacks are bought or sold, and, with its standard-deviation bands, as a measure of how stretched a move is. It resets daily, which makes it a same-day anchor and not a trend tool, and it is unreliable in the first hour of a session and on thin instruments.
Prerequisites for this lesson: How crypto prices move, Best timeframes for scalping (the entry and context charts VWAP is drawn on). Lesson 1 of the indicators section.
What VWAP measures
A moving average gives every candle the same weight whatever traded in it. VWAP weights each price by the volume traded there: a price where 50,000 BTC changed hands counts far more than one where 100 BTC did.
VWAP = Σ(price × volume) ÷ Σ(volume), from the start of the session
The line is the average cost of everyone who traded today. It is a fact about where business was done, not a forecast.
Why it resets
VWAP starts again at the session open, 00:00 UTC on most crypto venues. At 09:00 UTC it reflects nine hours of trading; by 20:00 UTC it reflects the whole day so far, and it takes more volume to move it. That is by design: VWAP is a same-day reference. Early in the session it is anchored to little data and swings on modest volume; wait for it to settle before using it as a level.
Bias: the main use
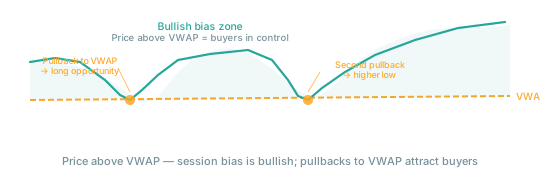
Price consistently above VWAP and bouncing off it from above: the day's buyers are in control, every dip to VWAP is a candidate long, and long setups have the better odds. Price consistently below and rejecting it from beneath: the sellers have the session, and rallies to VWAP are candidate shorts. Price crossing VWAP repeatedly: nobody has control, the session is choppy, and the narrow range lesson's advice applies: smaller size, tighter targets, or nothing.
The bias is a probabilistic tilt, not a rule. You can trade against it; setups with it deserve more confidence and more size.
VWAP as a level
Institutional desks and execution algorithms use VWAP as the benchmark for the quality of a fill, so orders are routinely worked "at or better than VWAP". When price falls to VWAP, an algorithm buying a large order below its benchmark starts filling; other participants see the buying; the level holds. This is why VWAP is a functional level and not only a technical one, and why it keeps working in a market where everyone knows about it.
Entries follow the pattern from the candlestick context lesson: a pullback to VWAP from above on falling volume, a rejection candle at the line, a long with the stop below VWAP and the wick; the mirror for shorts. The stop distance is checked against the ATR so that it sits outside the noise.
The bands
Most platforms draw VWAP with standard-deviation bands at ±1, ±2 and ±3.
| Band | Reading |
|---|---|
| +1 SD | first resistance above VWAP; in a trend, price rides along it |
| +2 SD | stretched; the odds of a return towards VWAP improve |
| −1 SD | first support below VWAP |
| −2 SD | stretched to the downside |
On a trending day price hugs the +1 band for hours; on a ranging day it rotates between +1 and −1. The bands say whether a move away from VWAP is ordinary or extended. At ±2 SD the reward for fading improves and the trade still needs confirmation from the tape; a stretched move on rising open interest is a trend, not an excursion.
VWAP and moving averages
| VWAP | EMA | |
|---|---|---|
| Resets | daily | never |
| Weighting | by volume | by recency |
| Shows | where today's average participant is positioned | recent price momentum |
| Use | session bias, intraday level | trend direction, pullback entries |
They complement each other. A common pairing is VWAP for the session bias and the EMAs for entry timing; when an EMA pullback lands on VWAP, the setup has two independent reasons to expect buyers.
Anchored VWAP
Anchored VWAP starts the calculation at an event you choose rather than at the session open: a major low, a major high, a news candle. It shows the average cost of everyone who traded since that event. Anchored to a swing low, it is the average entry of the buyers of the recovery, and a return to it is a return to their breakeven, where many defend. For scalping the session VWAP is usually enough; the anchored version is context for swings.
The traps
- Thin instruments. VWAP means something where volume is real and continuous, BTC and ETH perpetuals at the large venues. On a thin coin a few large orders distort it.
- VWAP as a wall. Price crosses it cleanly all the time. It is a reference zone; when price ignores it, that is information too.
- The first hour. Little data, large swings. Wait.
- Multi-day charts. A same-day tool on a weekly chart is a meaningless line. Use it on the 1-minute to 15-minute charts.
- Bias as permission. Above VWAP is a reason to prefer longs, not a reason to buy every dip. The setup still needs its trigger, its stop and its fee test.
Where to go from here
VWAP is the session's anchor. The next lesson is the trend tool that pairs with it.
- EMA scalping strategies: settings, pullback entries, and why the EMAs are switched off in a range.
Related guides:
- Volume profile: volume by price over a period, the profile that VWAP is the average of.
- Candlestick context: VWAP as the location layer of a candlestick setup.
- Order book and DOM: the live supply and demand that VWAP cannot show.
- Position sizing and risk management: the stop below VWAP sized in R.
- Best indicators for scalping: the section hub.
- Glossary: VWAP, EMA, volume profile.
This article is educational content, not investment advice. Trading derivatives carries substantial risk, including total loss of capital. See disclaimer.