Risk of Ruin: Why a Profitable Strategy Can Still Wipe You Out
TL;DR. Positive expectancy says a strategy should make money over a large number of trades. It says nothing about whether the account survives long enough to see that average arrive. Risk of ruin is the probability that a losing streak, well within normal variance, empties the account before the edge shows up, and the lever that controls it is not the edge but the fraction of the account risked per trade. The same strategy at 1% risk is close to unkillable and at 15% risk is a coin flip away from the end, and the recovery arithmetic means that a large drawdown is far harder to climb out of than it looks going in.
Prerequisites for this lesson: Trading expectancy (variance and the sample), Position sizing and risk management (the 1% to 2% rule), Crypto leverage (liquidation as ruin in one move). Lesson 9 of the basics section.
The oldest problem in probability
One of the first problems solved with formal probability is the gambler's ruin: two players with finite piles of chips play a fair coin-flip game for stakes until one is broke. Even with a fair coin, the player with the smaller pile goes broke more often, because they have less room to absorb a bad run. What fascinated the mathematicians who worked on it in the seventeenth and eighteenth centuries was the conclusion: the outcome depends not only on the odds but on the size of each bet relative to each player's pile. A player with a small edge, a large pile and small bets is almost certain to win eventually. The same player betting the pile on each flip can lose it on the first.
Replace chips with the account and bets with position sizes and you have risk of ruin in trading. It is the same three-hundred-year-old arithmetic.
Two traders, one edge, two endings
Two traders run the same strategy, the one from the expectancy lesson with +$10 of expectancy per trade, a 45% win rate, wins of $120 and losses of $80. The only difference is size: Trader A risks 1% of the account per trade, Trader B risks 15%.
Both have identical, positive expectancy, and both would make money over a large enough sample. The sample is what risk of ruin attacks. Before the law of large numbers has done its work for Trader B, an ordinary run of six losses, which a 45% win rate produces about once every thirty-six sequences of six, takes 62% of the account (0.85 to the sixth is 0.38). Trader A is down 6%. Trader A is irritated; Trader B is nearly finished, and the section on recovery explains why "nearly" is worse than it sounds.
The ruin curve
The relationship between risk per trade and the probability of ruin is not a line. It stays flat for a while and then turns upward:
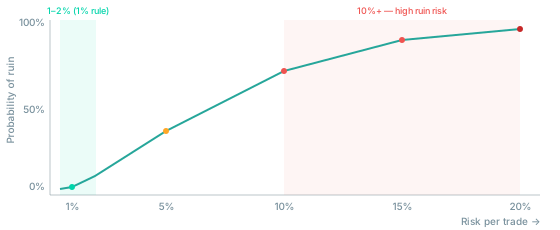
At 1% to 2% per trade, the range from the position sizing lesson, the probability that a normal losing run empties the account is close to zero even for a modest edge. Past roughly 10% the curve steepens: the streak that was an irritation at 1% is existential at 15%. The 1% rule is not caution for its own sake; it is a direct control on where you sit on this curve. Every time the sizing formula is applied, this is what is being managed.
Why drawdowns are worse than they look
The other half of ruin is the recovery arithmetic, which is asymmetric. Losing 10% requires an 11% gain to get back to even, which sounds fair. The relationship is not linear:
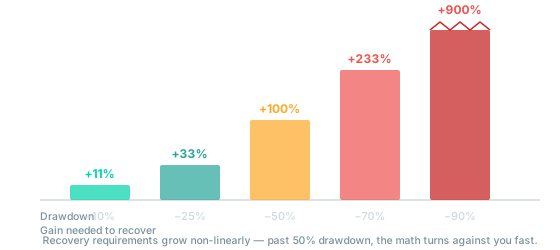
| Drawdown | Gain needed to recover |
|---|---|
| −10% | +11% |
| −25% | +33% |
| −50% | +100% |
| −70% | +233% |
| −90% | +900% |
A 50% drawdown requires doubling what is left to get back to the start. A 90% drawdown requires a tenfold return. "I will trade smaller and win it back" is mathematically far harder than it sounds once the drawdown has happened, and the common mistakes lesson describes the attempt to win it back fast, which is how a 50% drawdown becomes a 90% one. The time to control drawdown is before it, with the size.
Leverage moves you along the curve
Leverage is usually discussed as a liquidation price, which is correct: liquidation is risk of ruin in its most literal form, one move large enough to end the account regardless of the strategy behind it. Leverage does not change expectancy; entries, exits and edge are identical at 2× and at 20×. What it changes is the size of the bet relative to the bankroll, which is exactly the variable the gambler's ruin problem identified as the one that decides survival. Two traders with the same edge and different leverage are Trader A and Trader B from the earlier section.
Why the early phase is the dangerous one
The expectancy lesson showed that the first thirty to fifty trades of any strategy are dominated by noise: the rolling average swings widely before settling. That is precisely when risk of ruin is most dangerous, for two reasons.
- Variance is least averaged out. A losing run that is unremarkable across five hundred trades is a large share of the first fifty.
- There is no data yet. A large drawdown in the first fifty trades poses a question that cannot be answered, normal variance or no edge, and oversized risk turns it into a forced decision under pressure instead of a calm one made later with a record.
This is why testing a strategy properly before risking meaningful capital matters: the noisy phase happens on money you can watch swing, before the sizing decisions have consequences, and the playbook lesson puts the expected losing streak on the card so that it is expected when it comes.
Where to go from here
Sizing, expectancy and ruin are now one picture: the edge decides whether you make money over time, the size decides whether you are still there when it happens. The last lesson in the section is about the context that every crypto trade shares, whatever the setup.
- Crypto market correlation: why Bitcoin is the index, when crypto follows equities, and the thirty-second check before every altcoin trade.
Related guides:
- Trading expectancy: why edge is invisible over small samples.
- Position sizing and risk management: the 1% to 2% rule in practice.
- Crypto leverage: liquidation and the buffer beyond the stop.
- Common scalping mistakes: the behaviours that move a trader up the ruin curve.
- Crypto scalping basics: the section hub.
- Glossary: drawdown, position sizing, expectancy.
This article is educational content, not investment advice. Trading derivatives carries substantial risk, including total loss of capital. See disclaimer.