Win Rate vs Risk-Reward Ratio: What Makes a Strategy Profitable?
TL;DR. Win rate and risk/reward ratio are two halves of one equation. A 40% win rate with wins twice the size of losses makes money; a 70% win rate with wins a quarter the size of losses loses it. What decides profitability is the expectancy, the average result per trade, and the win rate vs risk-reward question is only ever about which combination of the two produces a positive one after fees. The trap is that win rate is the number that feels good, so beginners raise it by cutting winners early and letting losers run, which is exactly the trade-off that drives expectancy below zero.
Prerequisites for this lesson: Position sizing and risk management (what 1R means), Trade execution (what fees cost per trade). Lesson 7 of the basics section.
The equation
Every trade ends as a win or a loss. The expectancy, the average profit per trade over many trades, is:
Expectancy = (Win rate × Average win) − (Loss rate × Average loss)
In units of R, where a loss is 1R and a win is R times the risk:
Expectancy = (Win rate × R) − (1 − Win rate) × 1
The strategy makes money when this is positive.
The breakeven win rate
For any risk/reward ratio there is a win rate below which the strategy loses, before fees:
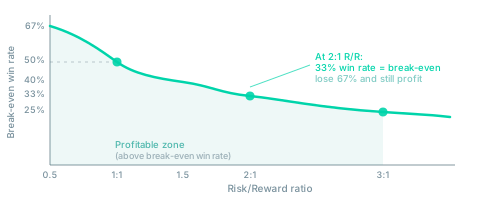
| Risk/reward | Breakeven win rate |
|---|---|
| risk 1, make 0.5 | 67% |
| risk 1, make 1 | 50% |
| risk 1, make 1.5 | 40% |
| risk 1, make 2 | 33% |
| risk 1, make 3 | 25% |
Example. Risk $100 to make $200 (2R). Breakeven is 33%. At a 40% win rate:
(0.40 × $200) − (0.60 × $100) = $80 − $60 = +$20 per trade
Profitable while losing six trades in ten.
The other way round. A 70% win rate, risking $200 to make $50:
(0.70 × $50) − (0.30 × $200) = $35 − $60 = −$25 per trade
A 70% win rate that loses money. This profile is common among beginners, and the next section explains why.
Why beginners drift towards bad R
Closing a winner feels good; watching a winner turn into a loser is painful; admitting a loser is worse. The result is that winners are taken early, which shrinks the average win, and losers are held in the hope of recovery, which grows the average loss. Win rate rises, expectancy falls. A trader with good entries can lose steadily this way, and the account statement will show a high win rate the whole time.
A minimum R per setup, written before the trade, is the mechanical counterweight. The exit strategy lesson shows how much of the difference between 1R and 3R on the same trade is the exit rule alone.
The scalping trade-off
On higher timeframes the targets are large relative to the noise: a swing trade aiming for 5% with a 2% stop (2.5R) at a 45% win rate is comfortable. On a 1-minute chart, a target of 0.3% against noise that regularly moves 0.15% is a different problem, and many scalpers find their realistic R is 1 to 1.5 rather than 3.
That means scalpers need a higher win rate than swing traders for the same expectancy. At 1.2R the breakeven is about 45%. It is not a high bar, and it requires that losses are never allowed to run. Scalpers who insist on 3R targets on the 1-minute chart find that price reverses before the target on most trades, and the win rate collapses as "nearly there" trades close slightly negative. The answer is not a ratio from a book; it is the R your setups achieve over a large sample, measured, and targets set from that. The playbook lesson is the record that supplies it.
Expectancy needs a sample
Over five trades any combination of win rate and R produces a range of results, including profits from a negative-expectancy system and losses from a positive one. Over two hundred trades the arithmetic asserts itself. Consequences:
- Thirty to fifty paper trades cannot tell you whether a strategy has an edge; the expectancy lesson shows how wide the error bars are.
- A profitable week proves nothing; it can be a lucky run inside a losing system.
- A losing week may be fine; a 40% win rate produces strings of five to seven losses as a matter of course.
The minimum sample for judging expectancy is around a hundred trades, and a few hundred is better.
Fees belong in the equation
Every calculation above is before fees, and fees are paid on every trade, win or lose. If the edge is $20 per trade and the round-trip fee is $8, the expectancy is $12. If the fee is $20, the expectancy is zero and you are working for the exchange.
The fee depends on the order type and on the position size, and the position size depends on the stop. A tight-stop scalp has a large position and a large fee in R: the range fade lesson shows a setup where maker fees are 0.22R per trade and taker fees 0.55R, which turns a gross expectancy of +0.25R into +0.03R or −0.30R. Order type is not a detail of execution; it is a term in the expectancy equation.
Measuring your own
- Log every trade: entry, exit, result in R.
- After fifty trades, compute the win rate, the average win in R and the average loss in R.
- Expectancy = (win rate × average win) − (loss rate × average loss).
- Subtract the average fee in R.
- Positive: the setup has an edge at this sample, to be confirmed at a hundred. Negative: find which of the three inputs is the problem.
It is arithmetic, not mathematics, and it is the minimum feedback loop that separates a system from a habit.
Where to go from here
You can now judge a setup by its expectancy rather than its win rate. The next lesson is where expectancy comes from and why it is invisible over small samples.
- Trading expectancy: expected value, the law of large numbers, and why a good strategy loses for weeks.
Related guides:
- Position sizing and risk management: turning R into a position size.
- Trade exit strategy: how the exit rule sets the average win.
- Scalping playbook: the record that measures win rate and R per setup.
- Trade execution: fees as a term in the equation.
- Crypto scalping basics: the section hub.
- Glossary: win rate, risk/reward ratio, expectancy.
This article is educational content, not investment advice. Trading derivatives carries substantial risk, including total loss of capital. See disclaimer.