Trading Expectancy Explained: Formula, Edge & Examples
TL;DR. Trading expectancy is the average result per trade over a large number of trades: win rate times average win, minus loss rate times average loss. A strategy with positive expectancy makes money over time even though each trade is close to a coin flip; a strategy with negative expectancy loses money over time even though it produces winning streaks. Entries, indicators and patterns matter only in so far as they move this one number above zero after fees. The limitation is the sample: expectancy is invisible over twenty trades and reliable only over a few hundred, which is exactly the period in which most traders decide whether a strategy "works".
Prerequisites for this lesson: Win rate vs risk/reward (the formula and the breakeven table), Position sizing and risk management (1R). Lesson 8 of the basics section.
A dice dispute from the 1650s
In the 1650s a French nobleman with a taste for dice asked a mathematician a practical question: if a game is interrupted before it ends, how should the stakes be divided according to each player's chance of winning had it continued? Pascal and Fermat worked it out in a series of letters, and their answer did more than settle a bet. Instead of asking what the next roll would bring, they asked what each outcome was worth multiplied by how often it happened, summed across outcomes. That sum is what we now call expected value.
Half a century later Jacob Bernoulli proved the other half: as a random process is repeated, the average outcome converges on the expected value even though no single repetition is predictable. Together those two ideas are the mathematical foundation of every casino, every insurer and every trading strategy that has ever made money consistently. A casino does not know whether the next spin is red or black and does not need to; it knows that its 2.7% edge on European roulette shows up as profit over millions of spins, almost exactly. Scalping runs on the same principle with a smaller edge, a harder one to find, and a much noisier environment.
What expectancy is
Expectancy = (Win rate × Average win) − (Loss rate × Average loss)
Positive, and the strategy makes money over a large enough sample. Negative, and it loses over a large enough sample, whatever the last week felt like.
The figure shows one trade's expectancy as two branches, a win and a loss, each weighted by how often it occurs:
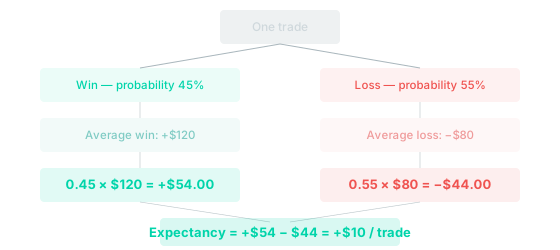
The strategy in the figure loses more often than it wins, 55% to 45%, and has positive expectancy because the average win is large enough relative to the average loss. That is the distinction between expectancy and win rate, and the win rate vs risk/reward lesson works through the trade-off.
Why a positive-expectancy strategy still loses
Expectancy describes the average, never a single outcome. A strategy with +$10 of expectancy does not produce +$10 on the next trade; it produces +$120 or −$80, and the +$10 appears only when many trades are averaged. Any individual trade, and any run of ten, can sit far from the average through randomness alone. So:
- A good strategy can lose five, eight or twelve trades in a row. That is normal variance, not evidence that the edge is gone.
- A bad strategy can win five, eight or twelve in a row. Also normal, and it is how losing systems convince people they work, shortly before they stop.
A trader who cannot tell "a losing run because variance is variance" from "a losing run because the edge is gone" does the wrong thing at the wrong time: abandons a working strategy after an ordinary streak, or keeps trading a broken one because it worked last week.
The law of large numbers, drawn
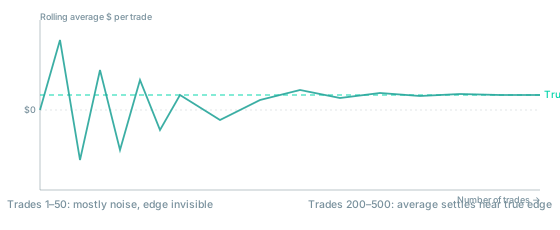
Over the first thirty to fifty trades the rolling average swings widely: the strategy looks like a loser, then a big winner, then a loser again, and none of it says much about the underlying edge. By two hundred to five hundred trades the noise has mostly cancelled and the average sits near the true expectancy. That is why paper trading for a weekend tells you almost nothing, why a bad week says nothing about whether the strategy is broken, and why the playbook lesson asks for fifty trades before a setup is judged and a hundred before it is sized up. At twenty trades the measured win rate of a 58% strategy can land anywhere between 36% and 80%.
The trap of judging edge by feel
Humans match patterns, and pattern matching is the wrong tool for evaluating expectancy.
Recency bias makes the last few trades feel decisive. Three losses in a row feel like proof that something is wrong, when three losses in a row is the expected behaviour of a strategy that wins 45% of the time: it happens about once in every six sequences of three.
The hot hand runs the other way. A short winning run on a mediocre setup feels like validation, "I have found something", when it is indistinguishable from a lucky run at a roulette table.
The gambler's fallacy is the belief that after several losses a win is due. It is not. Each trade's outcome, with independent setups, does not know what the previous ones did.
The defence against all three is the same: record every trade, compute expectancy from the record over a large sample, and trust the number over the feeling. How to start scalping covers building the record.
Where expectancy comes from in scalping
An edge is a recurring market behaviour that puts the odds slightly in your favour. In crypto scalping the common sources are:
- Liquidity-driven moves. Price is drawn towards the places where orders cluster, which makes some levels more predictable than random (how prices move).
- Range behaviour. Markets spend most of their time rotating between support and resistance, which the range fade exploits.
- Breakout follow-through. When a range breaks with participation, the move carries further than a reversal trader expects (range breakout mechanics).
- Sweep reversals. Price pierces an obvious level, the stops there fire, and it reverses because the forced orders were the only fuel (stop-hunt reversal).
None of these works every time and none needs to. Each has to work often enough, by a large enough margin, that the expectancy is positive after fees. That is the whole game, and the fee term is not small: the range fade lesson shows a setup whose gross expectancy of +0.25R becomes +0.03R with limit orders and −0.30R with market orders.
Where to go from here
Expectancy says that a strategy should make money over time. The next lesson is about whether the account survives long enough for "over time" to arrive.
- Risk of ruin: why position size, not edge, decides survival, and why drawdowns are harder to recover from than they look.
Related guides:
- Win rate vs risk/reward: the breakeven table and measuring your own expectancy.
- Position sizing and risk management: the sizing that lets expectancy pay out.
- Scalping playbook: sample sizes, error bars and the review that reads the record.
- How to start scalping: building a record large enough to mean something.
- Crypto scalping basics: the section hub.
- Glossary: expectancy, win rate, drawdown.
This article is educational content, not investment advice. Trading derivatives carries substantial risk, including total loss of capital. See disclaimer.