Crypto Implied Volatility & Skew Explained
TL;DR. Implied volatility is the size of move the options market is charging for, backed out of option prices, and the single number that decides whether an option is cheap or expensive. Implied volatility crypto readers use, DVOL, gives the level; the skew gives the shape, and in Bitcoin the shape almost always tilts the same way: out-of-the-money puts trade at a higher volatility than calls the same distance away, because holders pay for protection and few pay for upside. A trader who never buys an option can still read both. The limitation is that IV is a price, not a forecast; it is usually above the volatility that follows, and the gap is a premium sellers collect and buyers pay.
Prerequisites for this lesson: Options Greeks (vega, and the conversion of annual volatility to a daily move), What is volatility. Lesson 3 of the options track.
What implied volatility is
An option's price depends on the strike, the time to expiry, the current price, interest rates and one number that cannot be observed: the volatility the market expects until expiry. Fix everything observable, take the price the market is paying, and solve for the volatility that makes the model return that price. The result is implied volatility, and it is the language in which options are quoted between professionals: a 14-day $100,000 call is "55 vol" before it is "$4,295", because the volatility is comparable across strikes and expiries and the dollar price is not.
IV is set by supply and demand for options. When holders want protection and buy puts, put prices rise and so does the IV backed out of them. When nobody wants options, IV falls. It rises before scheduled events and falls after them, rises in crashes and falls in calm. Unlike a sentiment survey, it is paid for: every point of IV is a premium someone handed over.
The conversion every trader makes
IV is annualised, and its use is in converting it to the horizon of a decision, as lesson 2 showed:
- Daily one-standard-deviation move ≈ IV ÷ 19.1. At 55%: 2.9%, about $2,880 on Bitcoin at $100,000.
- Over n days: IV × √(n ÷ 365). Seven days at 55%: 7.6%. Thirty days: 15.8%.
- The at-the-money straddle price ≈ 0.8 × IV × √(n ÷ 365) × spot, and it is the market's estimate of the average absolute move to expiry. Seven days at 55%: about 6.1%, or $6,100, which is what the 7-day straddle costs.
That last conversion is the practical test for any option purchase. A trader who expects a 3% move over a week, in a market pricing 6.1%, is buying something the market considers worth twice their forecast. The IV crush lesson applies it to the event trade.
DVOL: the level
The standard reading of Bitcoin's implied volatility is DVOL, the index Deribit computes from its own options chain the way the VIX is computed from S&P 500 options: a 30-day, strike-weighted implied volatility. A DVOL of 55 says the market is pricing a one-standard-deviation move of about 15.8% over the coming month.
DVOL gives the level of uncertainty. It says nothing about which direction the market fears. That is the skew.
Skew: the shape
Implied volatility differs by strike. Plot IV against the strike for a single expiry and the line is not flat; for Bitcoin it slopes down from the put side to the call side, with a rise at the far call wing. Out-of-the-money puts trade at a higher volatility than out-of-the-money calls the same distance from spot.
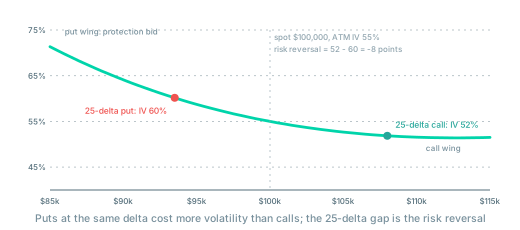
In money terms: the 14-day $93,000 put priced at 62% IV costs $1,981; at the at-the-money 55% it would cost $1,550. The $107,000 call priced at 50% IV costs $1,469; at 55% it would cost $1,793. The put buyer pays a third more than the flat model says, the call buyer a fifth less. That is the skew as a bill.
Why the tilt exists. Two reasons, and it is worth separating them. The first is demand: miners, funds and treasuries hold the asset and buy puts to protect it, and few participants buy calls for protection, so put premiums carry a permanent bid. The second is the distribution itself: Bitcoin's crashes are faster and larger than its rallies, so a model that prices a symmetric distribution underprices the put wing, and the market corrects it. Both reasons point the same way, and the tilt is the normal state, not a signal in itself.
The 25-delta risk reversal is how practitioners quote the skew: the IV of the 25-delta call minus the IV of the 25-delta put, both about the same probability of finishing in the money. In the figure it is 52 − 60 = −8 points. The 25-delta strikes are chosen because they respond most to a change in the slope, and the number strips out the level (which DVOL carries) and isolates the tilt.
Term structure: IV by expiry
Each expiry has its own IV, and the line across expiries is the term structure. Its normal shape rises with time: a 7-day option at 52%, a 30-day at 55%, a 90-day at 58%, because more can happen in three months than in a week and because a longer option carries more uncertainty about the volatility itself.
The informative shape is the inverted one: near-term IV above long-term. It says the market expects the next days to be more violent than the months after them, which happens around a scheduled event (the front expiry carries the event, the back ones do not) and in a crisis (the present is worse than the future is expected to be). Inversions in a crisis resolve fast, usually within days, and their resolution is a volatility collapse that pays sellers of the front expiry and punishes buyers of it.
Reading skew and term structure as a perpetual trader
None of this requires an options position. The readings are free from Deribit's chain, from the DVOL index and from the analytics services that compute the risk reversal, and they add a layer that no perpetual chart contains: what holders of size are paying to protect against.
- Put skew steepening while price is calm. Protection is being bought ahead of something. It is not a timing signal; hedges are bought days early. With rising open interest and stretched funding, it completes a picture of a market that is long and nervous, which is the state in which liquidation cascades start.
- Risk reversal turning positive. Calls dearer than puts: rare in Bitcoin, and when it appears it usually reflects call buying in a momentum phase or holders selling puts to fund upside. It marks a crowd leaning one way, not a direction to follow.
- Skew flattening towards zero with low DVOL. Nobody is paying for either wing. Complacent, low-conviction, range conditions, and the state from which volatility expansions start.
- Front-month IV above back-month. Something scheduled, or something happening. Check the calendar before reading it as fear.
Skew and term structure change slowly against price. They set the regime for the week, not the entry for the hour. The tools that matter for reading them are the chain itself and one analytics page, and five minutes before the session is enough.
The premium in implied volatility
One property of IV decides the long-run economics of every options strategy: it is usually higher than the volatility that follows. Sellers of options are selling insurance and charge for the risk of being wrong; dealers bias quotes a little high to protect their book; and events that have never happened are not in anyone's history but are in everyone's price. The result, measured across years in every liquid market, is that implied volatility exceeds subsequent realised volatility most of the time, by a few points on average. The literature calls the gap the volatility risk premium.
That premium is what a systematic option seller collects and what an option buyer pays, on average, for the asymmetry of lesson 1. It does not make selling safe: the average is earned in many small instalments and returned in a few large ones, and lesson 8 shows the shape. It does mean a buyer should have a reason beyond "the market might move": it might, and the price already says so.
Traps
- Reading IV as a forecast. IV is what options cost. It is biased high, it overshoots in panics and it collapses after events. A high IV is a reason to be careful buying, not evidence that a large move is coming.
- Comparing IV across strikes without the skew. A 62% put and a 50% call in the same expiry are both "normal" for Bitcoin. Judge each strike against its own history on the skew curve, not against the ATM number.
- Buying the front expiry into an inverted term structure. The inversion is the event premium. It is paid by whoever holds the front option when the event passes.
- Treating the skew as a directional signal. A steep put skew says protection is bid. Markets rally through steep skews often; the skew describes positioning, not the next candle.
Checklist
- DVOL now, against its range over the last three months: high, middle or low.
- The expected move for the horizon of the trade, from IV × √(days ÷ 365), and the straddle price as the market's own estimate.
- The 25-delta risk reversal for the front two expiries: the usual negative tilt, steeper than usual, or flat.
- The term structure: rising as normal, or inverted, and if inverted, what is on the calendar.
- Whether any option about to be bought is priced above the volatility that usually follows, and what justifies paying that.
Where to go from here
- IV crush in crypto options: the event trade, where the level of IV rises into an announcement and falls after it, worked through on a call that loses after a correct directional call.
Related guides:
- Options Greeks explained: vega, the sensitivity that turns a change in IV into a change in the position.
- VIX vs DVOL: how the index is built and how to convert it.
- What is volatility: realised volatility, the other side of the gap.
- Gamma exposure: positioning read through dealer hedging rather than through prices.
- Options risk management: the vega stress test before an event.
- Crypto options for beginners: the track hub.
- Glossary: implied volatility, vol skew, volatility risk premium, vega.
This article is educational content, not investment advice. Trading derivatives, including options, carries substantial risk, including total loss of capital. See disclaimer.