Crypto Market Volatility Explained: Causes, Measures & Risk
TL;DR. Volatility is the size of price moves over a period, measured as the spread of returns, and for a scalper it is both the raw material and the main hazard. Crypto market volatility is high because the market is leveraged, open around the clock, thin at some hours and driven by forced orders; it comes in clusters, so a quiet stretch tends to end suddenly and a wild one to persist. The number scales with the square root of time, which is how an annualised 45% becomes 2.4% a day and about $60 per minute on BTC at $100,000, and every stop, target and position size on this site is a function of it. The limitation is that realised volatility describes the past, and the regime it describes ends without notice.
Prerequisites for this lesson: ATR (volatility measured as candle range, the practical form), Position sizing and risk management. Lesson 1 of the volatility section.
What volatility is
Volatility is a statistical statement about how much price moves: the standard deviation of returns over a period, quoted as an annualised percentage. It does not say which way. An asset with 45% annualised volatility is expected to finish a typical year within about 45% of where it started, about two thirds of the time, in either direction. BTC has spent long stretches between 40% and 80%; equity indices spend most of their time between 12% and 25%.
Two versions matter to a trader. Realised volatility is measured from price history: the ATR, the width of the Bollinger Bands, the standard deviation of recent closes. Implied volatility is what the options market is pricing for the future, read from option premiums; the VIX vs DVOL lesson covers it. This lesson is about the realised kind.
How it scales with time
Volatility over a longer period grows with the square root of the time, because moves in different periods partly cancel. That rule turns one annual number into the scale for every chart:
| Period | Volatility at 45% annualised | On BTC at $100,000 |
|---|---|---|
| One year | 45% | $45,000 |
| One day | 45% ÷ √365 = 2.4% | $2,350 |
| One hour | 2.4% ÷ √24 = 0.48% | $480 |
| Five minutes | 2.4% ÷ √288 = 0.14% | $140 |
| One minute | 2.4% ÷ √1440 = 0.06% | $60 |
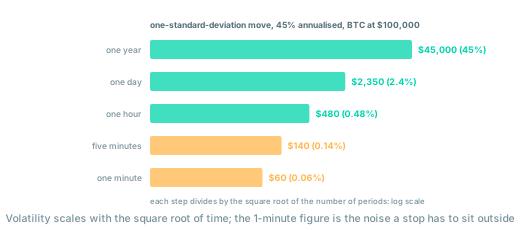
The bottom rows are the numbers the ATR lesson measures directly: the 1-minute ATR on BTC on an ordinary day is of the order of $60 to $150, and a stop inside that distance is a stop inside the noise. The table is the reason a 0.1% stop is fine on a 5-minute chart and hopeless on a 1-minute chart, and why the same trade needs a different size on the two charts.
Why crypto is more volatile
- Leverage and forced orders. A large share of crypto volume is leveraged perpetuals, and a leveraged position has a liquidation price. When price reaches a cluster of them the engine sells or buys at market, which moves price into the next cluster; the liquidations lesson describes the cascade. Equity markets have margin calls too, but not at 50× and not settled in seconds.
- No close. Crypto trades every hour of every day. There is no overnight to absorb news, so a headline at 03:00 UTC on a Sunday meets a thin book and moves price further than it would on a Tuesday afternoon.
- Uneven liquidity. The book is deep during the European and US overlap and thin in the Asian night and at weekends. The same order moves price more at 04:00 than at 14:00, and the ATR lesson's hour-of-day profile is the picture of it.
- Positioning cycles. Funding settlements, options expiries at 08:00 UTC and quarterly futures expiries create times when a lot of positions are adjusted at once.
- Small float in the tails. Beyond BTC and ETH, coins with a small free float and concentrated holders move on single orders.
None of these is a flaw to be avoided; together they are why a scalper's edge exists in crypto at all. The same features are why the leverage lesson treats 100× as a countdown rather than an opportunity.
Volatility comes in clusters
Benoit Mandelbrot observed in the 1960s that in financial markets large changes tend to be followed by large changes, of either sign, and small changes by small ones. Volatility clusters. A calm week is more likely to be followed by a calm day than by a wild one, until the regime changes, and the change is not announced.
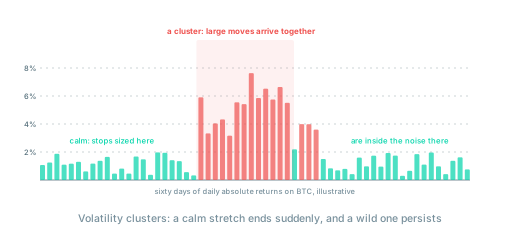
Two practical consequences. The volatility you measured this morning is the best estimate of this afternoon's, so sizing from the current ATR is correct more often than not. And the exceptions are exactly the days that matter: the first day of a cluster, when the ATR still describes the calm and the candles no longer do. The trading ranges lesson lists the signs that a compression is about to end; a rising ATR with the range intact is one of them.
Two kinds of volatility
Not all movement is tradeable. Directional volatility is a range breaking into a trend, an impulse, a pullback bought at the moving average: the candles are large and they mostly point the same way, and the trends lesson explains why it persists. Erratic volatility is a scheduled release: price up $1,000 and down $1,000 in the same minute, the book empty, spreads wide, stops filled far from their price. The ATR is high in both. The first is the environment scalping is built for; the second is the mistakes lesson's no-trade window.
Low volatility has the mirror problem. In a tight range the ATR is small, the fees are unchanged, and the narrow range lesson shows a $100 target against $40 to $100 of fees. The signal to stand aside is arithmetic, not mood.
What changes when volatility changes
Everything in the plan is a multiple of the current volatility, whether or not it was written that way:
| Plan item | Rule | When volatility doubles |
|---|---|---|
| Stop distance | 1.5 to 2 ATR beyond the level | doubles |
| Position size | risk ÷ stop distance | halves |
| Fees in R | fees on the notional ÷ risk | halve, because the position halved |
| Targets | in ATR units: 2 to 3 ATR for a trend leg | double in dollars, unchanged in ATR |
| Time stop | candles without progress | unchanged, and the candles are larger |
| Leverage | chosen so that liquidation sits beyond the stop | must fall, or the buffer shrinks |
A trader who keeps yesterday's stop and size after the ATR has doubled has doubled the risk without deciding to, and has a stop inside the new noise. A trader who keeps them after the ATR has halved has half the position the setup deserves and a stop the market will never reach. The sizing lesson's formula handles both cases if the ATR in it is today's.
Reading the regime
- The ATR on the entry chart, at this hour, against its level a week ago: higher means larger stops and smaller size.
- The Bollinger Band width: a squeeze is a compression, the Bollinger lesson's setup, and the moment stops sized on the squeeze become wrong.
- DVOL, the implied number: what the options market is paying for tomorrow's move, and the subject of the next lesson.
- The calendar: the release at 12:30 UTC is a volatility event with a timestamp.
Where to go from here
Realised volatility is the past measured. The next lesson is the future priced: what the options market expects, and how to convert it into the size of the day.
- VIX vs DVOL: implied volatility indices, the daily-move conversion, and what the direction of DVOL tells you.
Related guides:
- ATR: realised volatility as candle range, for stops and size.
- Bollinger Bands: the squeeze as compression before expansion.
- Liquidations: the forced orders behind crypto's largest moves.
- Position sizing and risk management: the formula that carries volatility into the size.
- Crypto volatility trading guide: the section hub.
- Glossary: ATR, implied volatility, liquidation cascade.
This article is educational content, not investment advice. Trading derivatives carries substantial risk, including total loss of capital. See disclaimer.