Two-Candle Reversal Patterns
TL;DR. Two-candle patterns are generally more reliable than single-candle ones because the second candle confirms the reversal in the same signal. Engulfing patterns are the most powerful of this group. All still require context — the right location in a trend — to be meaningful.
Why two candles are stronger than one
A single candle shows one period's battle. A two-candle pattern shows that battle extended over two periods — and the second period's result confirmed the reversal of the first. This makes the signal structurally more convincing.
The general rule: the stronger the first candle (the "setup") and the more decisively the second candle reverses it (the "trigger"), the more significant the pattern.
Bullish Engulfing

Appears: at the end of a downtrend
Signal: strong bullish reversal
Shape: first candle is bearish; second candle is bullish and its body completely engulfs the first candle's body
The Bullish Engulfing pattern is one of the most reliable two-candle reversal signals. It forms when:
- A bearish candle continues the downtrend (sellers still in control).
- The next candle opens below the first candle's close, then rallies strongly to close above the first candle's open.
The second candle's body has swallowed the first entirely. This represents a complete reversal of sentiment: sellers dominated the first period, buyers dominated the second — and more decisively, covering the entire range of the previous move.
Key requirements:
- Must appear after a clear downtrend (minimum 3–5 bearish candles prior).
- The engulfing body must cover the entire body of the first candle (not just overlap partially).
- Volume on the engulfing candle should ideally be higher — more buyers showing up confirms the reversal.
In scalping: strong Bullish Engulfing at known support or at a sweep of a recent low is a high-quality setup. Entry above the engulfing candle's high. Stop below the low of the pattern.
Bearish Engulfing
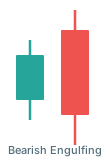
Appears: at the end of an uptrend
Signal: strong bearish reversal
Shape: first candle is bullish; second candle is bearish and its body completely engulfs the first candle's body
The mirror of the Bullish Engulfing. After an uptrend, a bullish candle is followed by a bearish candle that opens above the first candle's close and closes below its open.
The same logic applies in reverse: buyers controlled the first period, sellers overwhelmed them in the second. The seller victory is decisive — they recovered not just the gains from the first candle but pushed lower.
Scalping application: Bearish Engulfing at known resistance, at a sweep of a recent high, or after an extended rally. Short entry below the engulfing candle's low. Stop above the high.
Dark Cloud Cover

Appears: at the end of an uptrend
Signal: bearish reversal
Shape: first candle is bullish; second candle opens above the first candle's high but closes below the midpoint of the first candle's body
The Dark Cloud Cover is a bearish two-candle pattern. The name is evocative: a cloud (bearish second candle) rolls in over a sunny sky (bullish first candle).
Formation:
- A strong bullish candle continues the uptrend.
- The next candle opens above the first candle's high (a gap up — even in 24/7 crypto, this can manifest as a wick opening above the previous close).
- The second candle sells off to close below the midpoint of the first candle's body.
The penetration level matters. If the second candle only closes below the first candle's top but not below its midpoint, the signal is weaker and sometimes called a "cloudy day" rather than a Dark Cloud Cover.
Stronger if:
- The second candle closes in the lower half (below midpoint) of the first candle's body.
- Volume on the bearish second candle is heavier than the first.
- The pattern appears at a significant resistance level.
Piercing Line
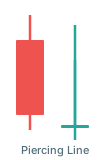
Appears: at the end of a downtrend
Signal: bullish reversal
Shape: first candle is bearish; second candle opens below the first candle's low but closes above the midpoint of the first candle's body
The Piercing Line is the bullish counterpart to the Dark Cloud Cover. After a bearish candle extends the downtrend:
- The second candle opens below the first candle's low (gap down or extended low).
- Buyers drive the second candle higher, closing above the midpoint of the first candle's body.
The bears had the market on the second candle's open, but buyers absorbed the selling and pushed aggressively higher — "piercing" back into the prior bearish candle.
Minimum penetration: above the 50% level of the first candle's body. Below 50% is a weaker "in-neck" or "on-neck" pattern — less reliable.
Bullish Harami
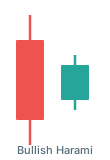
Appears: at the end of a downtrend
Signal: potential bullish reversal (weaker than Engulfing)
Shape: large bearish first candle; second candle is small and bullish, contained entirely within the first candle's body
"Harami" is a Japanese word meaning pregnant — the large first candle is the "mother," and the small second candle is the "child" contained within it.
After a strong bearish candle drives price lower, the second candle is small and bullish — entirely contained within the prior candle's body. This signals that the selling momentum has paused. Sellers drove the prior large candle, but the following period barely moved — indecision has entered.
Key distinction from Engulfing: the Harami is a warning of possible reversal, not a strong reversal signal itself. The bearish trend has stalled, but it has not been overcome. Confirmation from subsequent candles is essential.
Harami Cross — if the second candle is a Doji (open = close), the pattern is called a Harami Cross, and it is considered more significant than a regular Harami.
Bearish Harami

Appears: at the end of an uptrend
Signal: potential bearish reversal
Shape: large bullish first candle; second candle is small and bearish, contained within the first candle's body
The mirror of the Bullish Harami. A large bullish candle is followed by a small bearish candle entirely within the first candle's range. The uptrend's momentum has stalled — buyers produced a large candle, then struggled to produce any meaningful follow-through.
Again, this is a warning rather than a confirmed reversal. The pattern needs to be at a meaningful resistance level and requires confirmation from subsequent price action.
Tweezers: bonus two-candle patterns

Tweezers Top
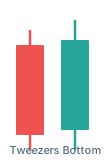
Tweezers Bottom
Tweezers form when two consecutive candles share the same high (Tweezers Top) or the same low (Tweezers Bottom). The repeated test of the same extreme at which price was rejected signals that the level is significant resistance or support.
Tweezers Top: two candles with matching highs at the top of an uptrend. Both times, price was pushed back from that level — resistance is clearly defined.
Tweezers Bottom: two candles with matching lows at the bottom of a downtrend. Sellers twice failed to hold price below that level — support is clearly defined.
Comparing pattern strength
From strongest to weakest, roughly:
| Pattern | Signal strength | Requires confirmation |
|---|---|---|
| Engulfing (bull/bear) | ★★★★★ | Helpful but less critical |
| Dark Cloud Cover | ★★★★ | Yes |
| Piercing Line | ★★★★ | Yes |
| Tweezers | ★★★ | Yes |
| Harami | ★★★ | Essential |
| Harami Cross | ★★★★ | Yes |
The strength ratings are guidelines, not fixed rules. Context can make a weaker pattern very significant, or a "strong" pattern meaningless.
Further reading
- Three-candle patterns — Morning Star, Evening Star, Three White Soldiers.
- Single-candle patterns — Hammer, Doji, Shooting Star.
- Candlestick context for scalping — how to apply these patterns with discipline.
This article is educational content, not investment advice. Trading derivatives carries substantial risk, including total loss of capital. See disclaimer.